
The field guide · Sun
Solar flares: what the letters mean.
A solar flare is a sudden release of electromagnetic radiation from the Sun. The A, B, C, M and X classes describe peak soft X-ray flux measured near Earth. Each class begins ten times above the previous one; flare class alone does not predict a geomagnetic storm.
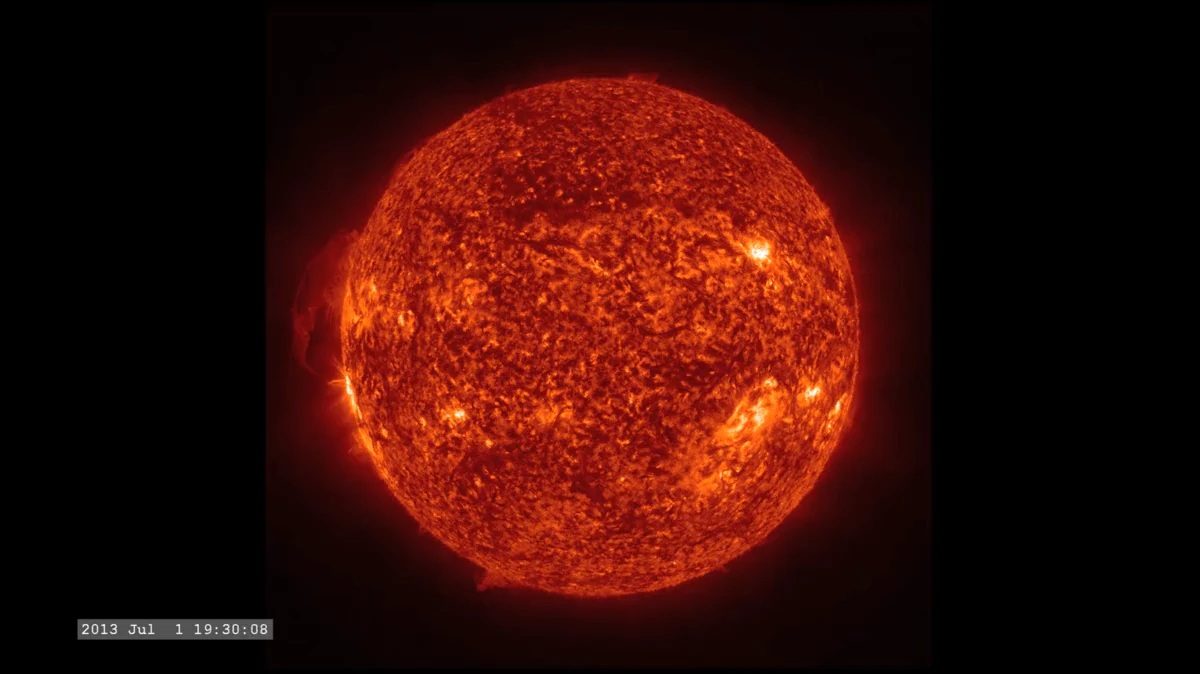
The classification measures a specific signal
The class is based on peak flux in the 0.1–0.8 nm soft X-ray band, not the apparent size of an orange feature in a solar photograph. NOAA’s flare reference explains the measurement and its connection to radio blackouts.
Swipe or use the arrow keys to see all columns.
| Class begins at | Peak soft X-ray flux |
|---|---|
| A1 | 10⁻⁸ W/m² |
| B1 | 10⁻⁷ W/m² |
| C1 | 10⁻⁶ W/m² |
| M1 | 10⁻⁵ W/m² |
| X1 | 10⁻⁴ W/m² |
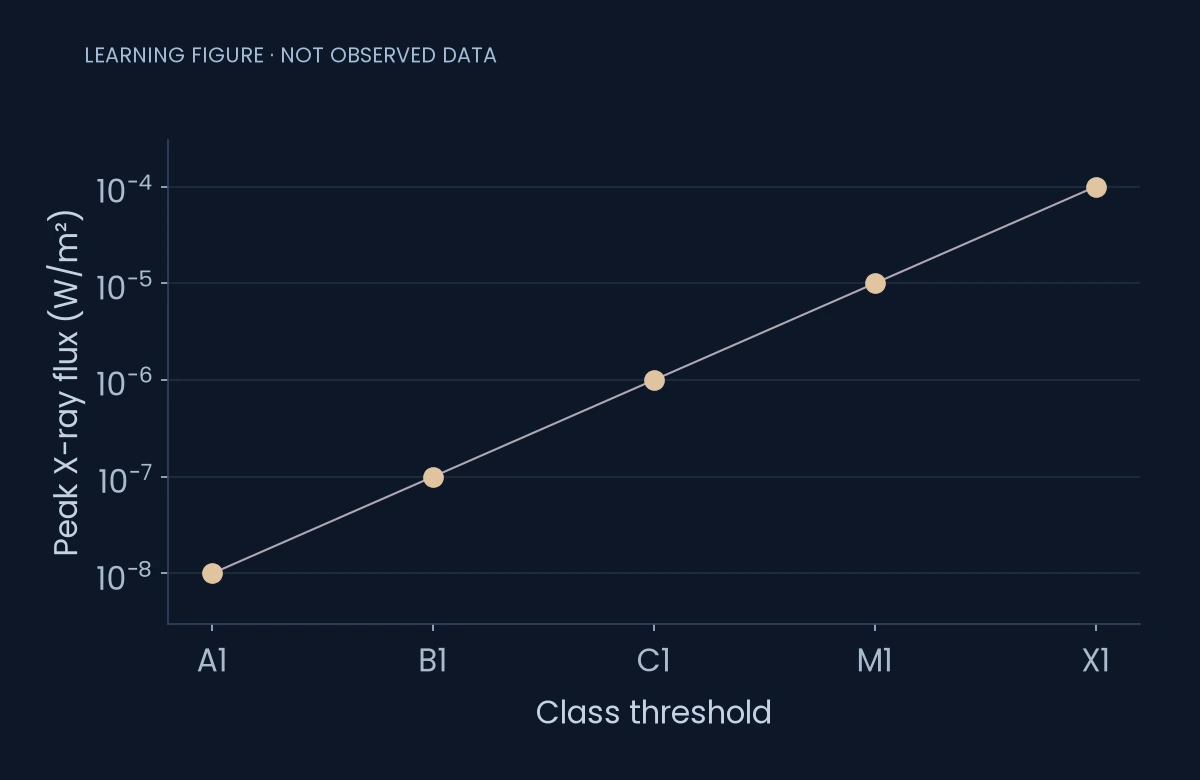 Open chart at full size ↗
The figure shows class thresholds, not observed flares. Its logarithmic axis makes each tenfold step equally spaced. X is not capped at X9: a sufficiently large event can have a larger multiplier.
How to read M5 or X2
The number multiplies the class threshold. M5 is 5 × 10⁻⁵ W/m². X2 is 2 × 10⁻⁴ W/m², four times M5 in this particular peak-flux measure. This arithmetic does not mean four times every possible consequence on Earth.
When reading a headline, retain both the class and the event time. A large flare from yesterday is not a statement about the Sun’s current X-ray flux.
Why a flare can affect radio quickly
Flare radiation travels at the speed of light. Increased X-ray and extreme-ultraviolet input can alter ionization on Earth’s sunlit side, affecting high-frequency radio propagation. NOAA reports radio-blackout severity with its R scale.
That effect is different from the later arrival of a cloud of magnetized plasma. Mixing the two creates misleading claims such as “the flare will arrive in three days.” The CME guide explains what can take much longer to travel.
A bright solar image is not a storm forecast
The archival SDO film below shows a prominence in false-color extreme ultraviolet imagery. It helps make solar structure visible, but it is not a visible-light photograph, a current observation or a labelled example of a particular X-ray flare class.
To judge a specific event, use its instrument report and original date. A dramatic visual and a high X-ray class still do not establish that an Earth-directed CME occurred or that a particular G-level storm followed.
Sources
- NOAA SWPC: flare classification and radio effects.
- NASA SVS: July 1, 2013 solar prominence, SDO/AIA 304.
- NOAA SWPC: CMEs are eruptions of plasma and magnetic field.
Keep exploring
Make room for your own observations.
Schumann Pulse brings environmental readings and your personal journal into one place. The app is coming soon for iPhone.
Explore the app