
The field guide · Earth
How do scientists measure Schumann resonance?
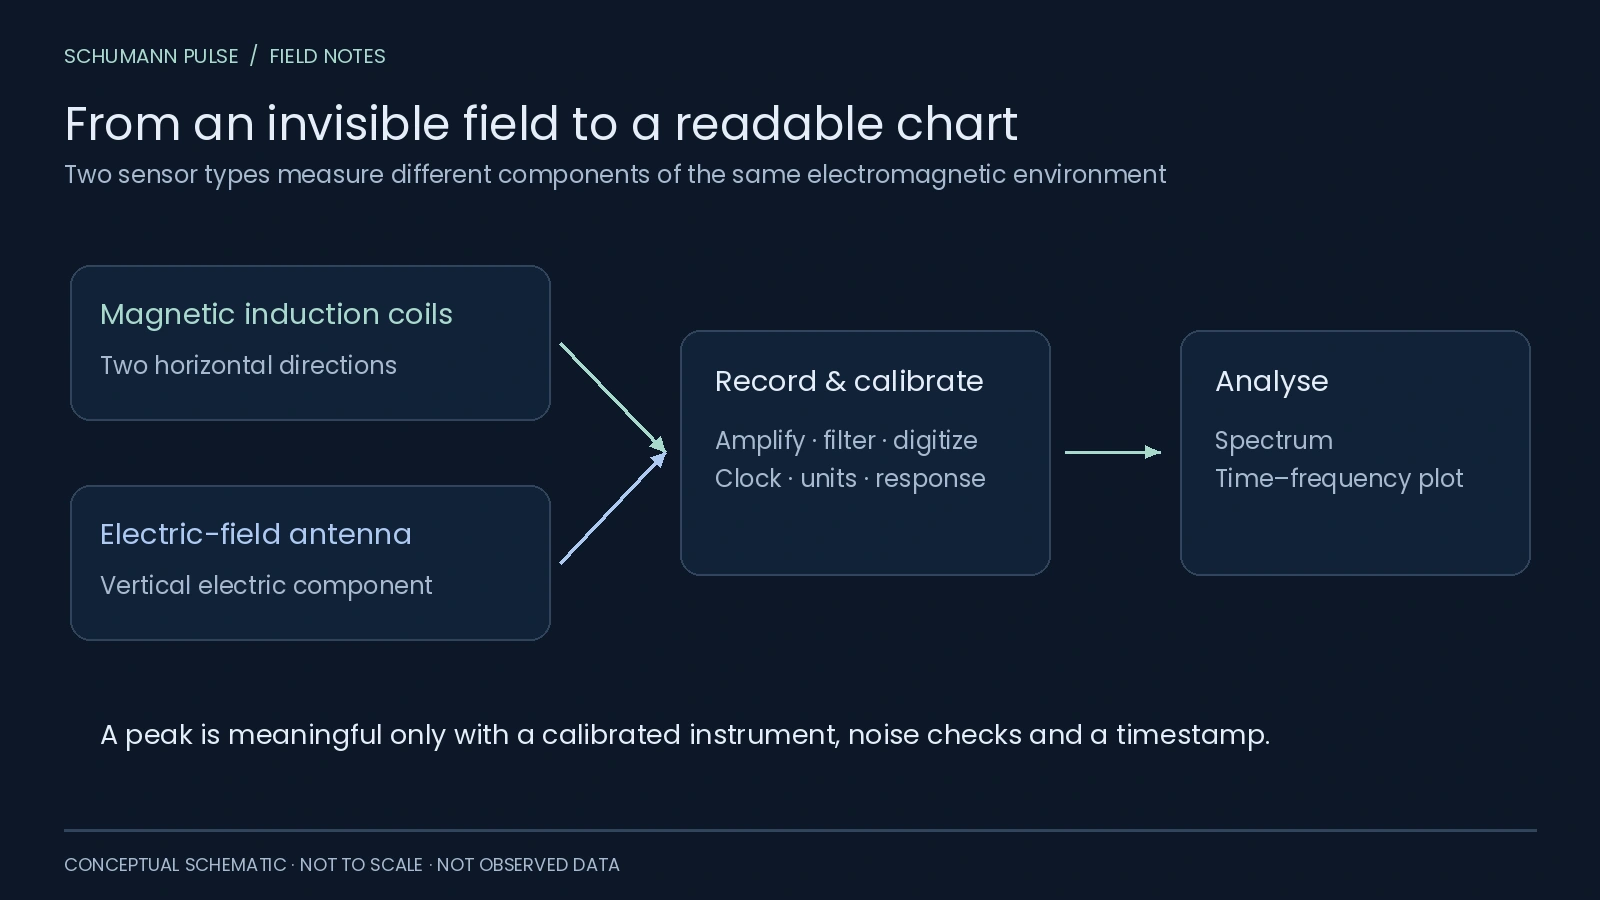
Scientists measure Schumann resonances with sensitive electric-field antennas or magnetic induction coils, then analyse recorded signals in the frequency domain. A reliable result needs calibration, a known time reference and checks for local interference; a colourful chart alone is not a measurement method.
 Open figure at full size ↗
What does an ELF station look like?
Often, much less dramatic than an optical observatory. A sensitive receiver and magnetic antennas may sit underground, far from buildings and power lines. There need not be a telescope dome at all.
The Cracow ELF group's WERA description specifies stations with two magnetic antennas and a receiver. It explains the use of remote locations and underground installation to support observation quality. That is why a photograph of a telescope is not an accurate substitute for an ELF instrument. WERA's instrument description.
Magnetic coils and electric antennas do different jobs
An induction coil responds to a changing magnetic field. Two coils aligned along different horizontal directions record different components. An electric-field antenna can measure a vertical electric component. These are related electromagnetic measurements, but their raw values and units are not interchangeable.
Nagycenk's documented display distinguishes north–south and east–west magnetic components from the vertical electric component. It also describes how amplitudes and frequencies of the first three modes are extracted from the electric record. Nagycenk technical report.
An “amplitude” label without a field component, units and processing method leaves a reader missing essential context. It should not be treated as a universal scale shared by every station.
How does a recording become a spectrum?
- Acquire a signal. The sensor and electronics produce a time series. The clock establishes when samples were taken.
- Account for the instrument. Its gain and frequency response affect which signals are amplified or attenuated. Calibration connects the recorded output to a physical quantity.
- Inspect interference and gaps. Local equipment, power systems or missing samples can distort the record.
- Estimate spectral content. Analysis separates contributions by frequency. Repeated estimates can be arranged into a spectrogram.
- Describe the peaks. Their position, width and amplitude are different fitted quantities, each with uncertainty.
This is a general explanatory sequence, not a claim that every station uses one identical algorithm. A published Sierra Nevada dataset, for example, records fitted parameters for the first three modes from ten-minute intervals. University of Granada dataset.
Why do stations need quiet surroundings?
An instrument records fields at its own location. A global natural background can coexist with a much stronger local disturbance. Quiet siting, suitable electronics and multiple independent records make it easier to separate them.
The historical problem was already visible in Balser and Wagner's early work: their team moved recording equipment away from power-line hum before processing the data. Modern equipment improves the tools, but does not remove the need to ask where a signal came from. Their original methods report.
Can a phone app measure it directly?
A displayed chart may come from a remote observatory rather than the phone's sensors. A product would need to demonstrate suitable sensitivity, calibration, bandwidth and noise control before a phone reading could be treated as a comparable ELF measurement. Simply labelling a feature “7.83 Hz” establishes none of those properties.
Schumann Pulse presents environmental readings from external sources. To understand their context, start with the station directory and then the chart-reading guide.
Sources
- Cracow ELF group: WERA station hardware.
- Nagycenk: recorded components and displayed parameters.
- University of Granada: Sierra Nevada measurement dataset.
- Balser and Wagner (1960): recording methods and noise.
Keep exploring
Make room for your own observations.
Schumann Pulse brings environmental readings and your personal journal into one place. The app is coming soon for iPhone.
Explore the app