
The field guide · Earth
How to read a Schumann resonance chart.
Read the source and timestamp first, then the axes and color legend. A Schumann spectrogram usually shows time horizontally, frequency vertically and signal intensity by color. Color is not a frequency measurement, and a blank interval is not automatically zero activity.
First, identify the kind of chart
A spectrum shows signal distribution across frequency for a selected interval. A spectrogram stacks successive spectra along a time axis. An amplitude time series follows a selected signal measure through time. These displays can describe related observations while answering different questions.
The Nagycenk observatory’s display documentation distinguishes dynamic spectra from extracted resonance parameters. That is a useful starting point when a screenshot has lost its original caption.
A worked spectrogram example
 Open chart at full size ↗
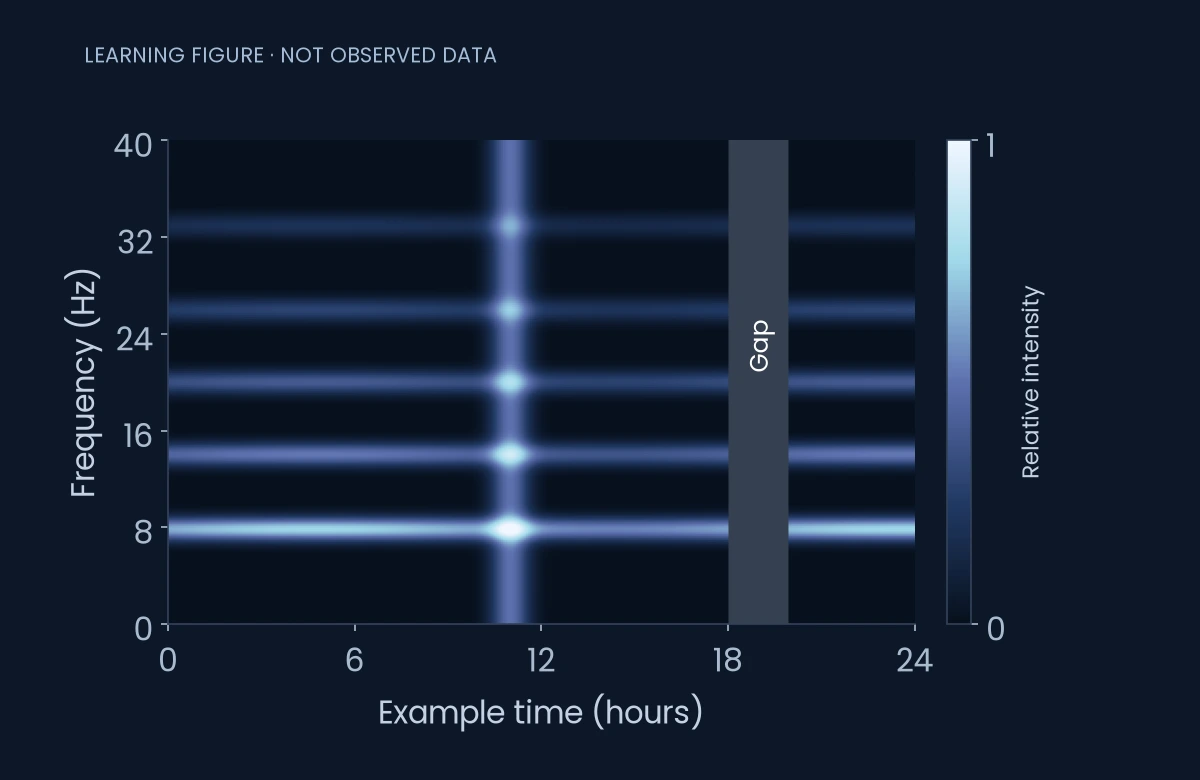
This is authored teaching data. Horizontal bands mark persistent frequency regions. A brighter vertical feature in the middle spans several bands. The shaded interval near the right edge is deliberately missing data. None of these marks describes current conditions.
Swipe or use the arrow keys to see all columns.
| What you see in this example | What it tells you | What it does not establish |
|---|---|---|
| A horizontal band near 8 Hz | Signal is present around that frequency | A universal fixed amplitude |
| A brighter vertical feature | Higher plotted intensity across frequencies | That the fundamental mode became a new high frequency |
| An empty shaded interval | Samples are unavailable in the example | That electromagnetic activity stopped |
| A color approaching the top of the legend | The plotted scale is near its upper display limit | An unlimited or precisely known extreme value |
Check the date and time zone
A screenshot can be shared days after it was captured. Look for a complete date, the plotted time zone and the last available sample. The page refresh time is not necessarily the measurement time. A chart covering the previous day may remain the latest available chart after a station interruption.
When comparing two sources, align their timestamps before comparing their shapes. A local-midnight boundary and a UTC-midnight boundary can split the same event into different dates.
Read color through the legend
There is no universal rule that white means an exceptional planetary event. It may represent the top of a color scale, clipping, missing data or a rendering convention. The original source’s legend decides. If the legend is absent, the honest conclusion is that the image cannot yet be interpreted quantitatively.
Changing a display’s color range can make the same observations look dramatically different. Keep the scale fixed when comparing days, or explicitly account for the change.
Separate observation from explanation
A chart may show a real change without identifying its cause. Instrument noise, processing, nearby interference, lightning distribution and ionospheric conditions need different checks. The British Geological Survey’s induction-coil work illustrates why recording equipment and scientific context matter.
A defensible caption says what was measured, where and when. A speculative caption starts with an unsupported explanation. Save the original source link with any screenshot so another reader can inspect the context.
A five-point reading checklist
- Identify the station and original page.
- Confirm the date, time zone and newest sample.
- Read every axis, unit and color scale.
- Locate gaps, clipped regions and source notes.
- State the observation before proposing a cause.
What happens before the chart?
A display begins with a sensor, a clock and a processing method. The instrument guide follows those steps and explains why calibration matters.
Sources
- Nagycenk: recorded field components, dynamic spectra and extracted parameters.
- British Geological Survey: high-frequency magnetometers and resonance research.
- Hylaty quick-look archive: original data and usage conditions.
Keep exploring
Make room for your own observations.
Schumann Pulse brings environmental readings and your personal journal into one place. The app is coming soon for iPhone.
Explore the app