
The field guide · Earth
Schumann resonance frequencies, explained.
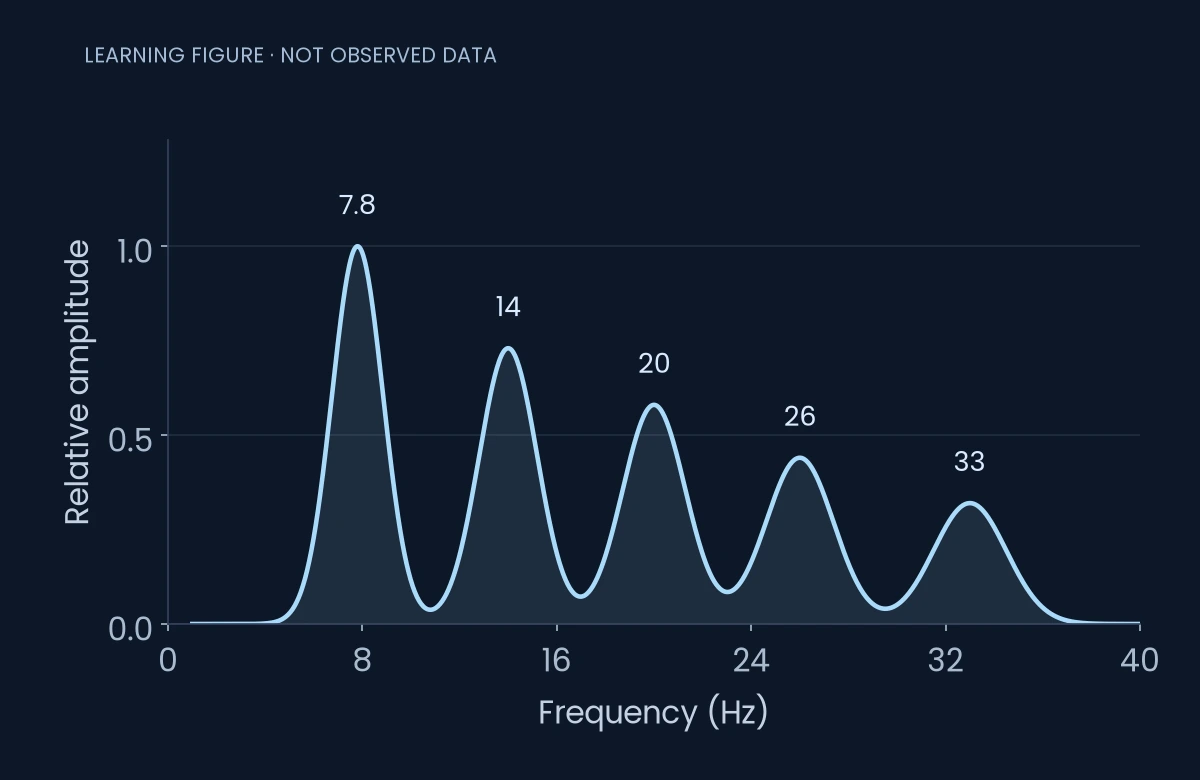
The first Schumann resonance is approximately 7.8 Hz. Other broad modes occur near 14, 20, 26 and 33 Hz. These values describe oscillation rates; amplitude and spectral power describe different properties of the recorded signal.
 Open chart at full size ↗
What does a hertz measure?
One hertz means one cycle per second. A frequency near 7.8 Hz therefore describes a field oscillating roughly eight times each second. It does not describe how strong the field is, how much energy a person has, or how quickly the whole planet rotates.
A useful reading habit is to say both the number and the unit aloud. “Eight hertz” and “eight relative units” may look similar in a headline, but they answer different questions.
The first five modes
The rounded values below are orientation points, not a specification that every observation must match. A four-year study using Sierra Nevada magnetometers examines regular variations rather than treating the modes as fixed constants.
Swipe or use the arrow keys to see all columns.
| Mode | Approximate frequency | How to interpret it |
|---|---|---|
| First | 7.8 Hz | The lowest prominent resonance band |
| Second | 14 Hz | A higher resonant mode |
| Third | 20 Hz | A separate band, not a jump of the first mode |
| Fourth | 26 Hz | Another higher mode |
| Fifth | 33 Hz | A higher-frequency band in the same system |
Open chart at full size ↗This teaching spectrum uses smooth mathematical peaks. Its vertical scale is normalized and has no physical calibration. It is not a station measurement or a model fitted to an observed day.
Frequency is not amplitude
Imagine a peak centered near 8 Hz becoming twice as tall while staying in the same place. Its plotted amplitude has increased; its central frequency has not doubled. Now imagine that same peak moving slightly sideways without becoming taller. That illustrates a frequency change.
A published plot may show electric field, magnetic field, amplitude spectral density, power spectral density or a provider-specific index. Those quantities cannot be substituted for one another. Compare values only after checking the axis and the processing method.
Why “Earth’s frequency rose to 40” is incomplete
Before accepting that statement, ask: 40 what? Which sensor? Which mode? At what time? Was the number read from a frequency axis or an amplitude label? A bright feature reaching 40 Hz on a spectrogram may cover a wide frequency range; it does not demonstrate that the lowest resonance has become 40 Hz.
The Nagycenk display documentation is a useful real example: it describes dynamic spectra and separately extracted mode amplitudes and frequencies. These are different views of the observations, not interchangeable names for one number.
Can you hear 7.83 Hz?
A plotted electromagnetic frequency is not automatically an audio recording. Audio advertised with this number may be synthesized or use modulation. It should not be presented as direct evidence of what a ground observatory measured. Our guides explain environmental measurements, not audio treatments.
Why the unit is called hertz
The unit honours Heinrich Hertz and his electromagnetic-wave experiments. It measures cycles per second, independently of a signal’s strength.
Sources
- Rodríguez-Camacho and colleagues: Sierra Nevada resonance study.
- Geophysical Observatory Reports: automatic ELF and resonance displays at Nagycenk.
- NASA: the Earth–ionosphere resonance mechanism.
Keep exploring
Make room for your own observations.
Schumann Pulse brings environmental readings and your personal journal into one place. The app is coming soon for iPhone.
Explore the app