
The field guide · Earth
Schumann resonance and geomagnetic storms are different signals.
Schumann resonances are lightning-excited electromagnetic modes of the Earth–ionosphere cavity. Geomagnetic storms are disturbances of Earth’s magnetic environment driven by solar-wind conditions. They can be studied together, but one reading is not a substitute for the other.
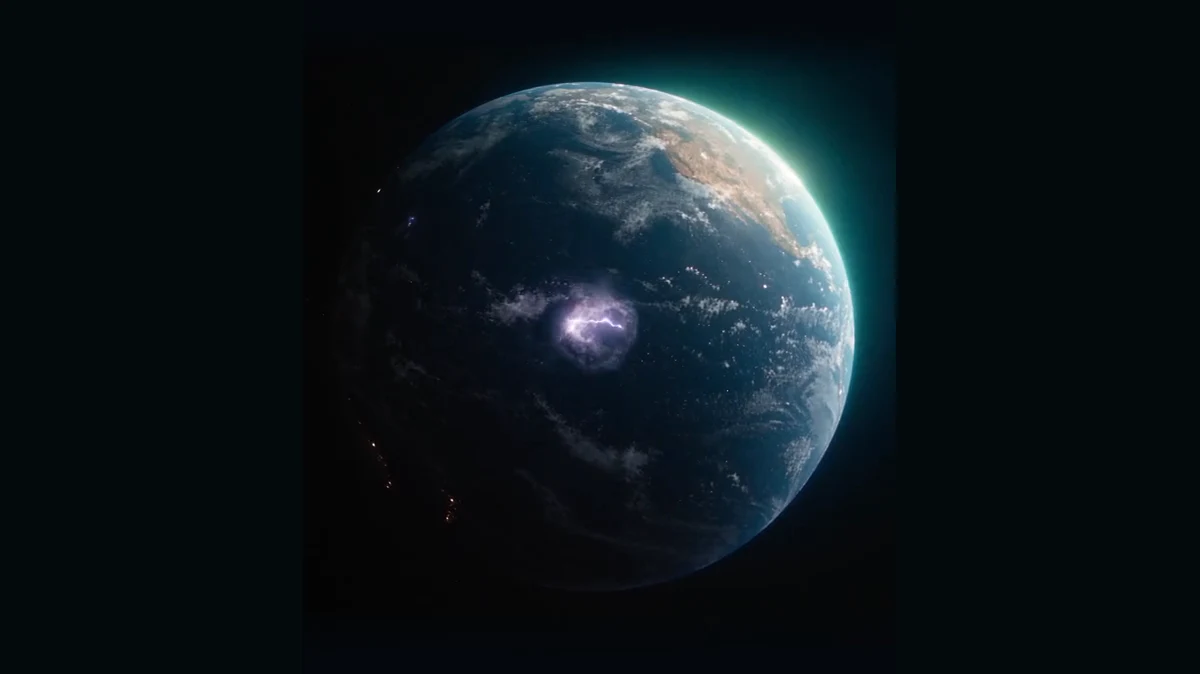
The shortest useful comparison
Swipe or use the arrow keys to see all columns.
| Question | Schumann resonance | Geomagnetic storm |
|---|---|---|
| What is being described? | Resonant ELF signals around Earth | A disturbance of the magnetosphere |
| Main excitation or driver | Lightning | Energy transfer from the solar wind |
| Typical display | Spectrum, spectrogram or mode parameters | Geomagnetic indices and storm bulletins |
| Units or scale | Frequency in Hz; field or spectral units depend on the plot | Kp, NOAA G scale, or other magnetic indices |
| Useful first check | Station, field component and scale | Index product, observation window and bulletin time |
NASA describes the resonance mechanism; NOAA describes geomagnetic storm drivers. They are different physical explanations, not competing brand names for one measurement.
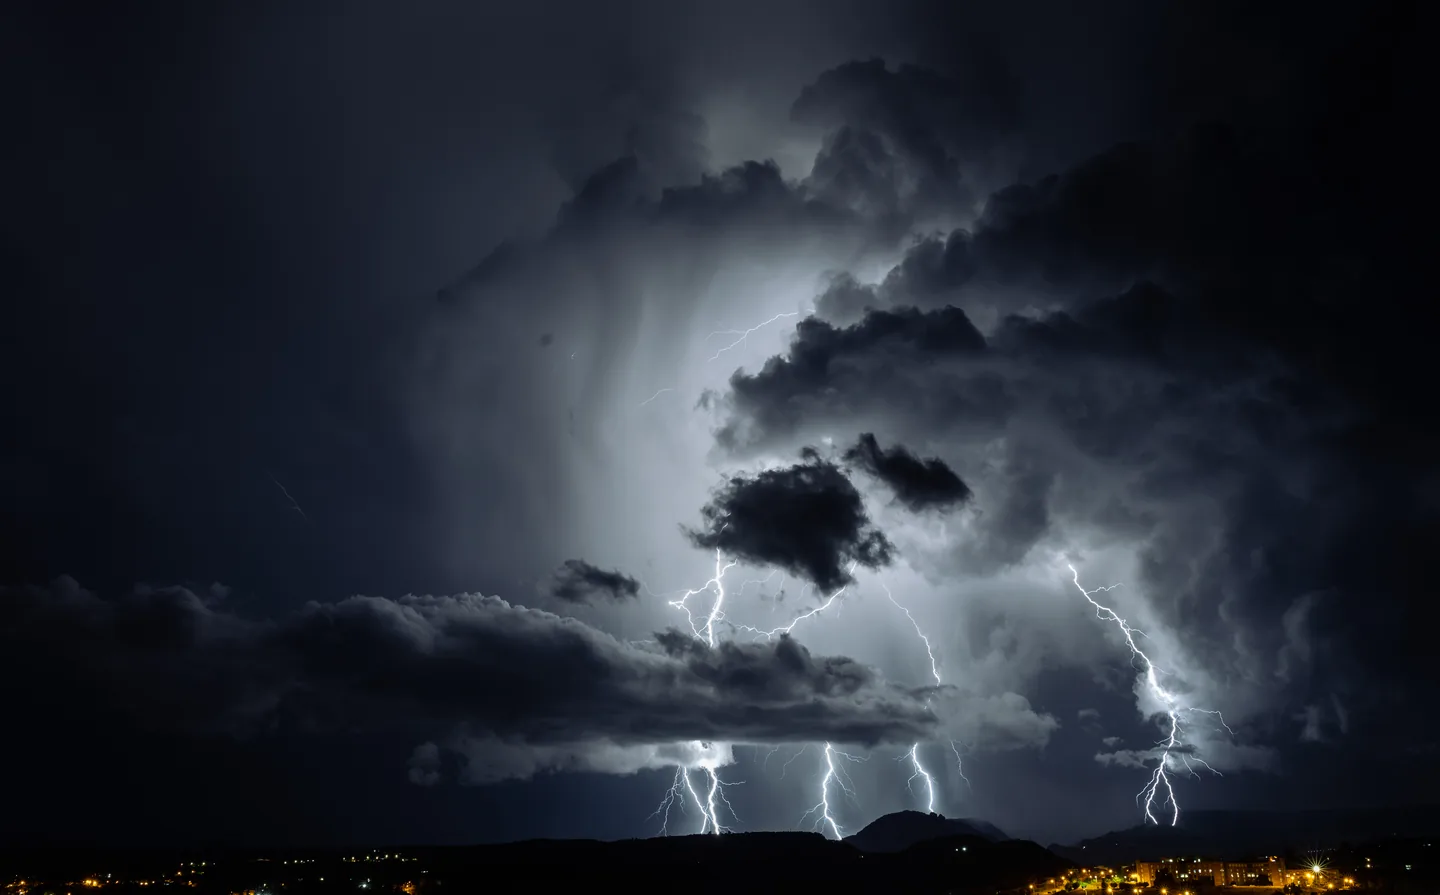
Earth lightning
Geomagnetic activity
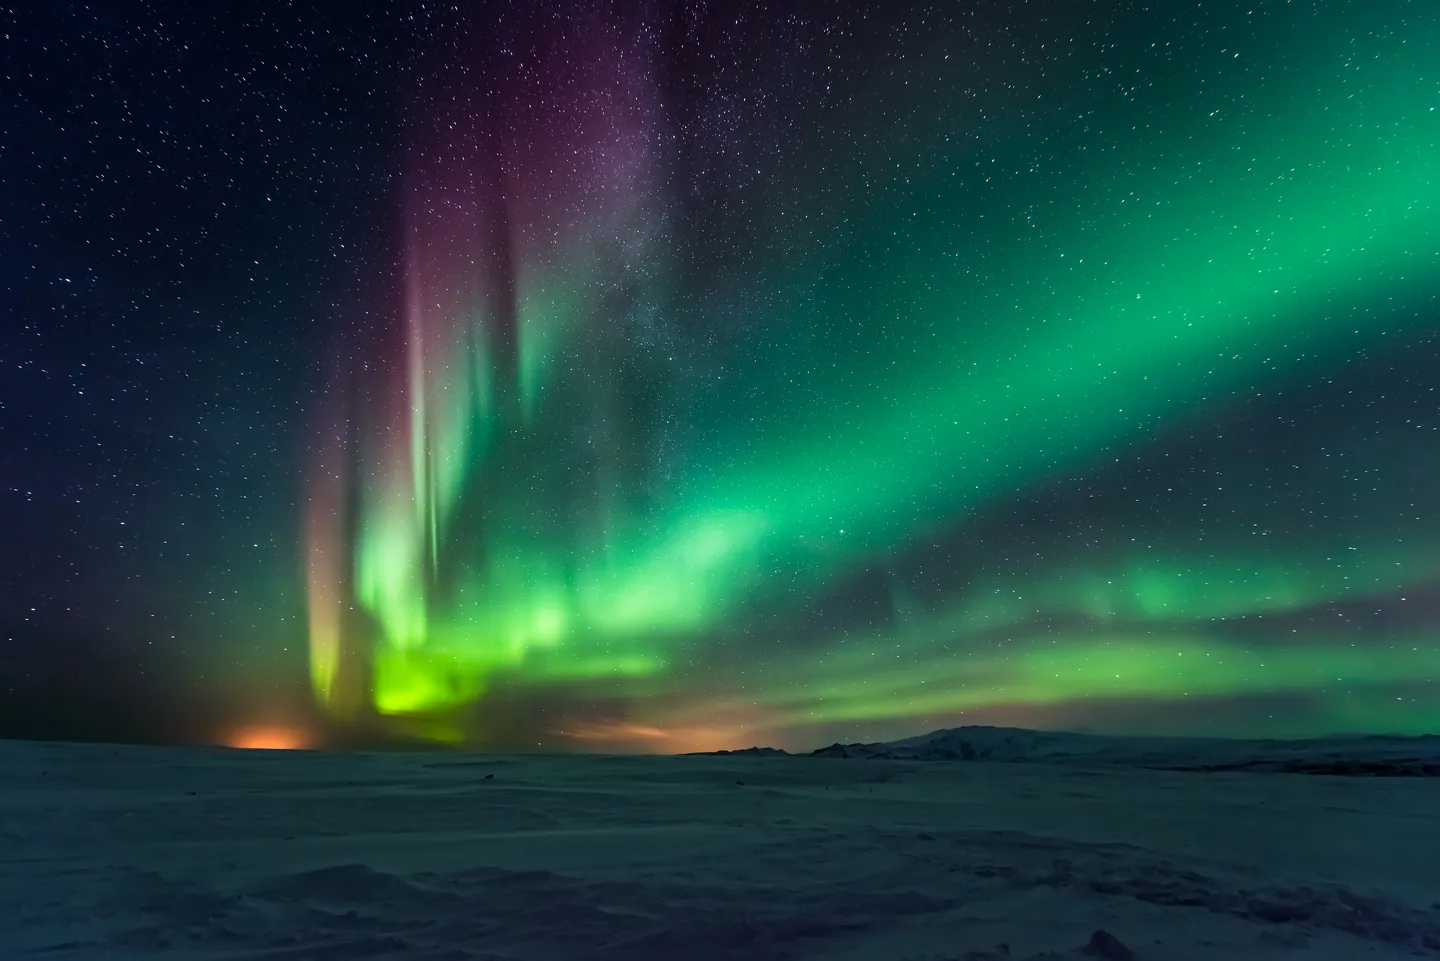
The photographs illustrate different visible phenomena. Neither photograph is a measurement, and the aurora image does not identify a storm strength.
Why the two appear together in an app
Both offer context about the environment around Earth. Putting them beside one another can make a day easier to explore, provided the labels preserve what each series means. A shared time axis is an organizational choice, not a conversion formula.
For example, a Schumann amplitude reading of 6 and a Kp of 6 are not equal magnitudes. Kp 6 belongs to a specific geomagnetic classification. The amplitude’s meaning depends on its instrument and units. Matching digits do not establish a physical relationship.
Does solar activity influence the resonance environment?
The ionosphere is part of the resonance cavity and also responds to the space environment. That makes relationships scientifically interesting. It does not justify claiming that every bright spectrogram patch is a solar storm, or that a geomagnetic storm must produce a particular Schumann amplitude.
To investigate a proposed relationship, first specify the measurement, time interval and hypothesis. Then compare enough observations, account for gaps and test other explanations. A visually striking pair of screenshots is a starting question, not a result.
Keep personal observations independent
A journal entry records a person’s experience. An environmental series records an instrument or derived index. A useful comparison preserves both without assigning one the meaning of the other.
Write a feeling in your own words before interpreting the chart, retain ordinary days as well as unusual ones, and avoid selecting only examples that fit an expected story. Schumann Pulse presents environmental context beside a journal; it does not infer a diagnosis from a reading.
Which guide should you open next?
If the confusing number is labelled Hz, amplitude or spectral power, open the Schumann frequency guide. If it is Kp or G1–G5, open the Kp guide. If you have only a cropped image without units, find the original source before drawing a conclusion.
Sources
- NASA Goddard: Earth–ionosphere resonances.
- NOAA SWPC: geomagnetic storms.
- GFZ: the planetary Kp index.
Keep exploring
Make room for your own observations.
Schumann Pulse brings environmental readings and your personal journal into one place. The app is coming soon for iPhone.
Explore the app