
The field guide · Sun
Geomagnetic storms: from G1 to G5.
A geomagnetic storm is a significant disturbance of Earth’s magnetosphere caused by energy transfer from the solar wind. NOAA describes its severity with G1, Minor, through G5, Extreme. The G scale concerns geomagnetic activity, not solar-flare brightness or personal symptoms.
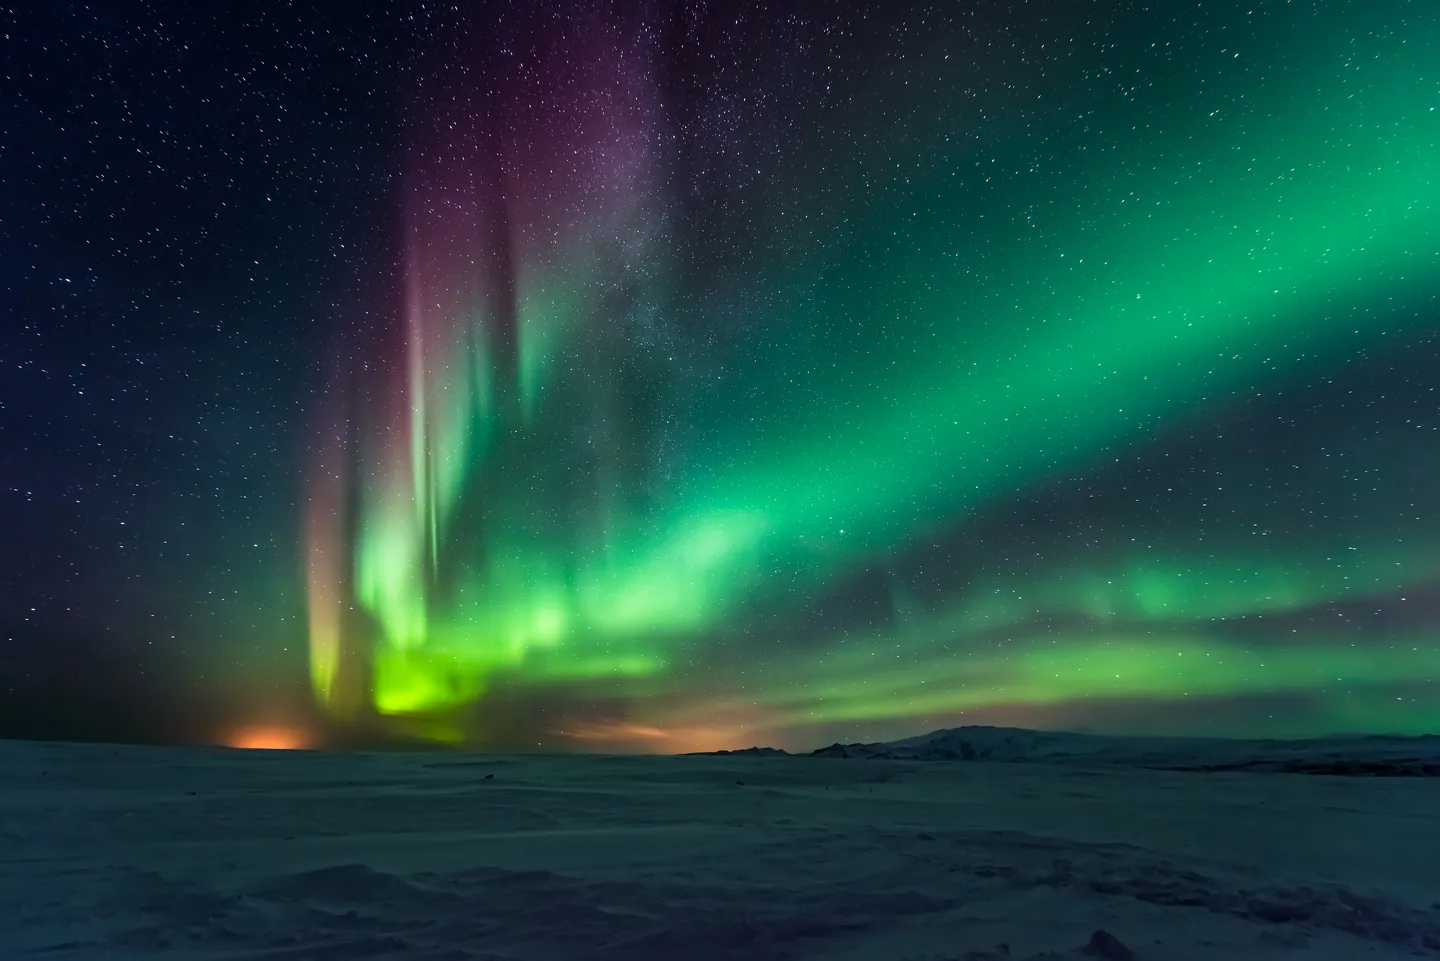
What causes a geomagnetic storm?
Earth’s magnetic environment is continuously exposed to the solar wind. Under some conditions the interaction transfers much more energy into the magnetosphere. The orientation of the incoming magnetic field matters as well as speed: a sustained southward component can favor stronger coupling.
NOAA’s storm explanation identifies both CMEs and high-speed solar-wind streams as important drivers. That is why “there was no large flare” is not enough to rule out geomagnetic activity.
The G1–G5 scale
The table summarizes NOAA’s named levels and its published headline Kp associations. Kp has thirds notation; use the issuing agency’s classification rather than rounding a decimal display yourself. NOAA explicitly includes 9− under G4.
Swipe or use the arrow keys to see all columns.
| NOAA level | Name | Published Kp association |
|---|---|---|
| G1 | Minor | 5 |
| G2 | Moderate | 6 |
| G3 | Strong | 7 |
| G4 | Severe | 8, including 9− |
| G5 | Extreme | 9 |
NOAA’s complete scale describes possible effects at each level. Effects vary by system and location. The level is not a guarantee that a particular household will lose power or that an observer will see aurora.
Why the impacts vary
A storm can alter the upper atmosphere and near-Earth plasma environment. Potential consequences include satellite drag, navigation errors and geomagnetically induced currents. Different systems have different exposure and protection; a single global label cannot describe every local outcome.
Aurora can become more widespread during disturbed conditions, but the view still depends on location, darkness and clouds. For a practical explanation, see what causes aurora.
Forecast, current activity and earlier peak
Consider an invented bulletin sequence: a G3 watch is issued for tomorrow, the following day begins at lower activity, and a G2 interval is later observed. Those statements can all be accurate. They refer to a forecast, an earlier state and a subsequent observation.
Likewise, “G3 earlier today” does not mean G3 now. A page should preserve the time of the peak and the time of the latest observation. Screenshots without these labels are easy to misread after conditions change.
How to follow a storm without losing context
Open the original bulletin and check the issue time, expected or observed interval, scale letter and revision status. Then inspect the index product behind the claim. A planetary index and a local magnetometer trace provide different views of the event.
The Kp guide explains the three-hour index. The alert guide explains the language of watches, warnings and alerts. For operations affected by space weather, use the appropriate official service and your organization’s procedures rather than this educational summary.
A storm from the historical record
The Carrington event of 1859 connects early solar observers with magnetic records and auroral reports. Its severity is reconstructed from historical evidence, not a modern satellite feed.
Sources
- NOAA SWPC: geomagnetic storms and their drivers.
- NOAA: full G-scale definitions.
- GFZ: Kp index production and observing stations.
Keep exploring
Make room for your own observations.
Schumann Pulse brings environmental readings and your personal journal into one place. The app is coming soon for iPhone.
Explore the app