
The field guide · Earth
Where is Schumann resonance measured?
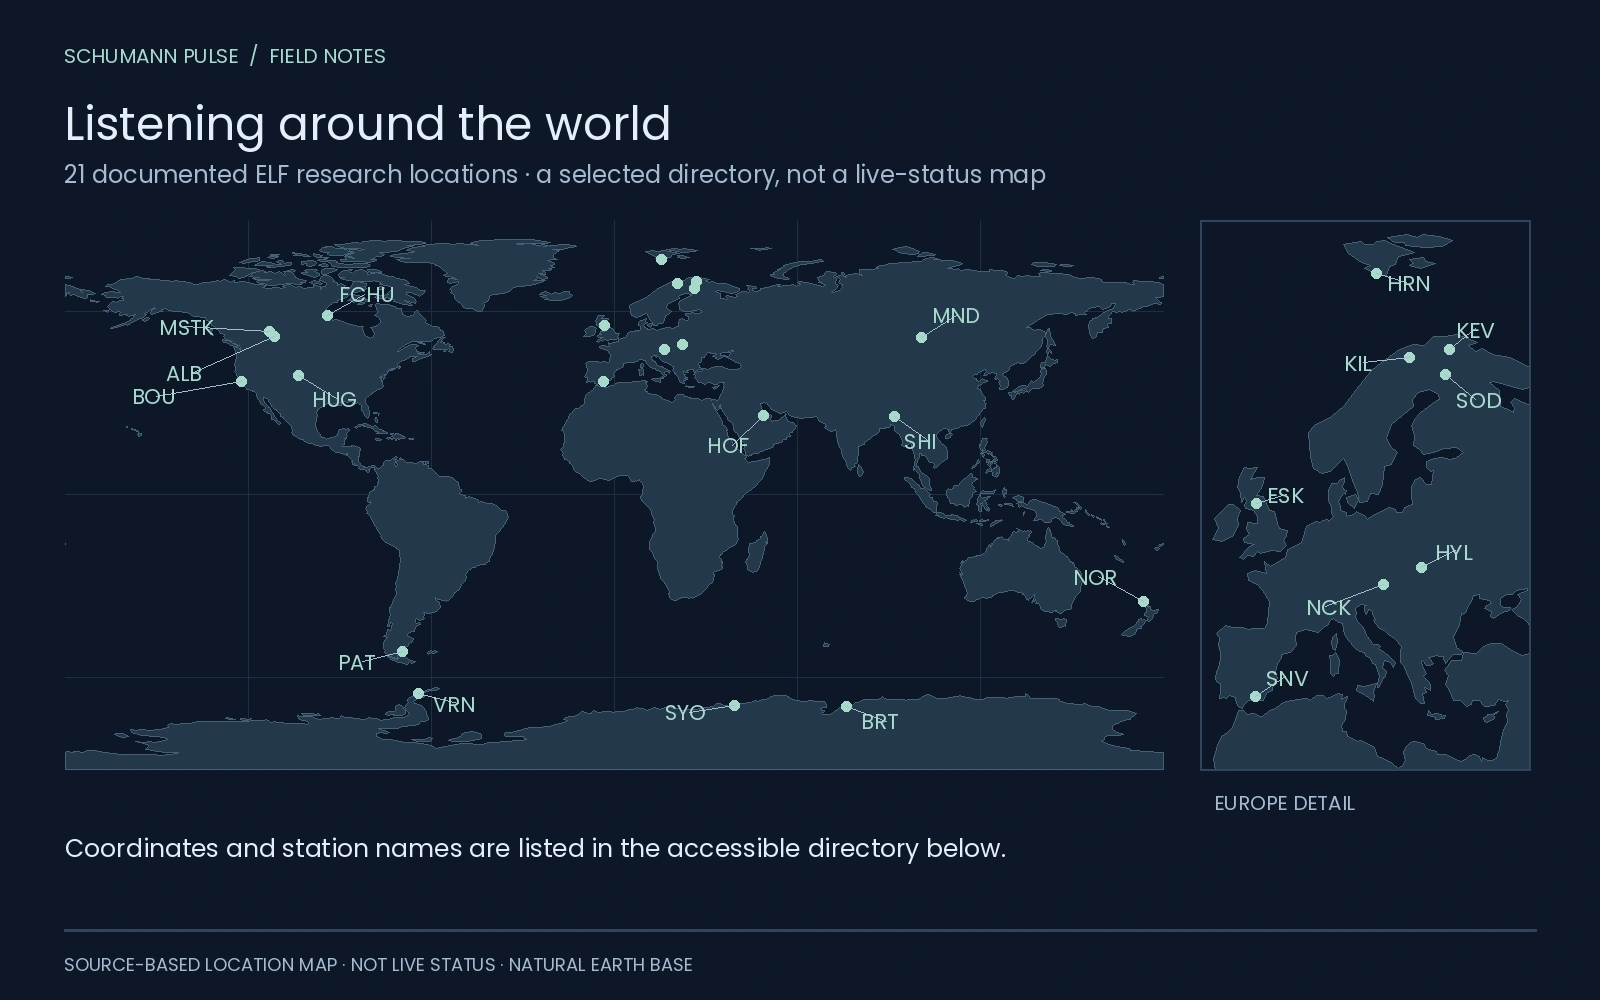
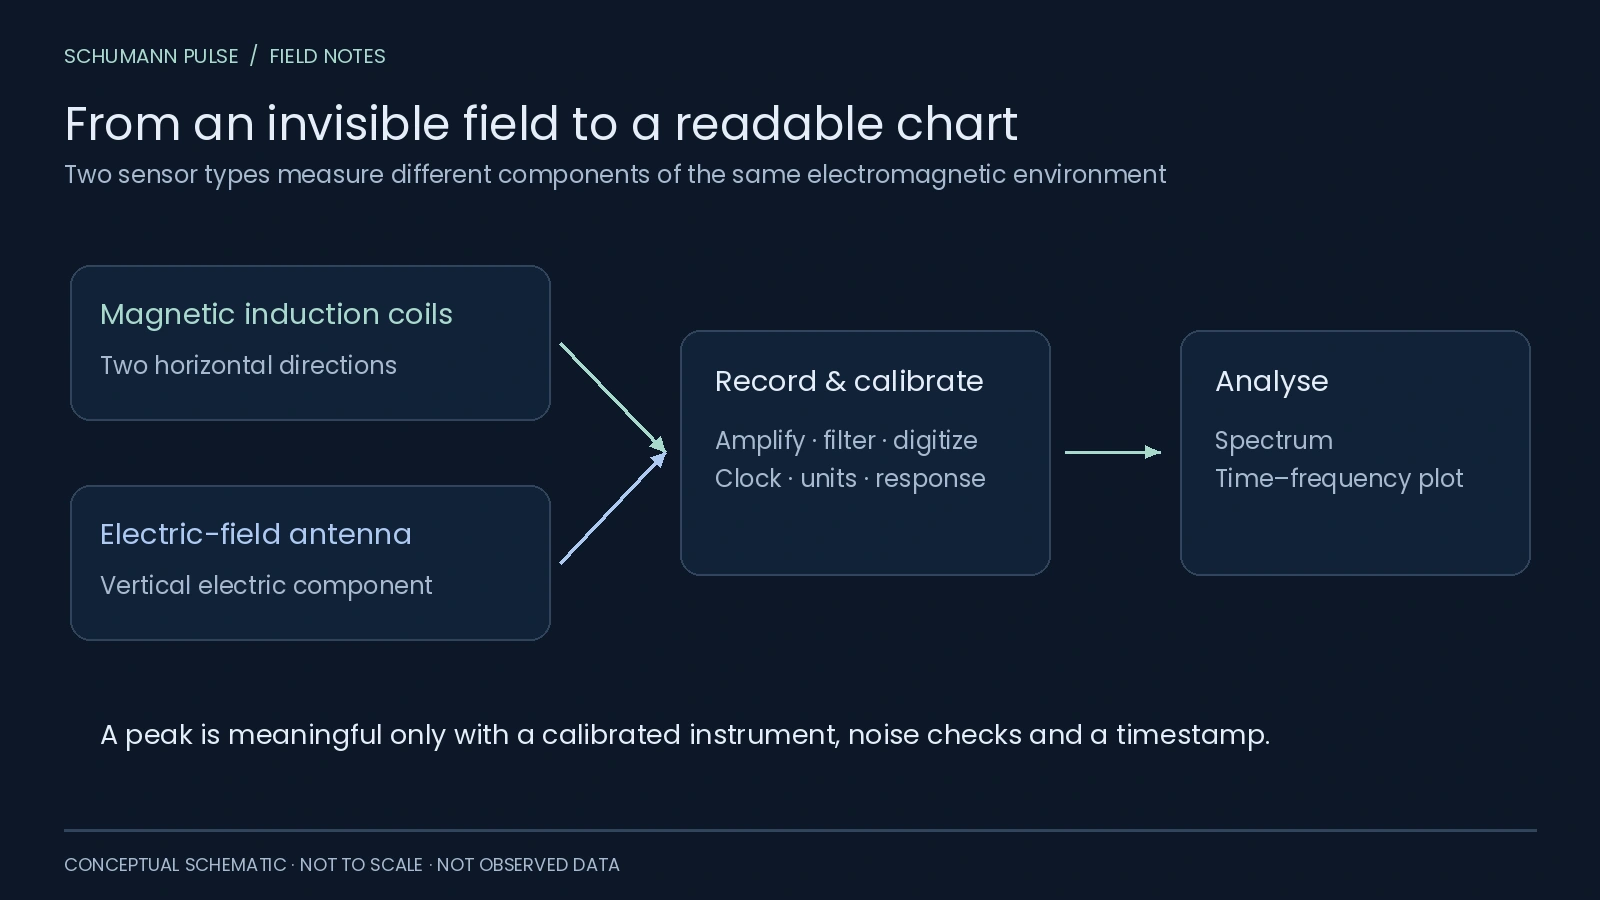
Schumann resonance is measured at specialized ground stations using electric-field sensors and magnetic induction coils. Documented sites span several continents. A research station, a public chart and a continuously available live feed are three different things.
 Open figure at full size ↗
What the station map includes
The map brings together 18 sites used in a 2023 multi-station Schumann resonance study, plus documented locations at Nagycenk, Sierra Nevada and Syowa / West Ongul. It covers sites in the Americas, Europe, Asia, New Zealand and Antarctica. The 18-site paper analysed a January 2019 interval; appearing in that study does not establish a station's operating status in 2026.
Coordinates reproduce the cited research or institutional records. They are not a survey of individual antenna positions, and a research receiver may be away from a main observatory building. In particular, the West Ongul ELF site is separate from the main Syowa station on East Ongul. The labels SNV and SYO are short map identifiers here, not claims of official network codes.
Tomsk remains in the directory below. Its public monitor documents the city, but this review did not establish precise sensor coordinates from a suitable source, so no guessed station pin is added.
Names and coordinates on the map
Latitude is positive north; longitude is positive east. Published coordinate precision varies. The map and this table are generated from the same source registry.
Swipe or use the arrow keys to see all columns.
| Site · map label | Region | Latitude / longitude | Coordinate source |
|---|---|---|---|
| Alberta · ALB | Canada | 51.89°, -111.47° | Bozóki et al. 2023, Table 1 |
| Bharati · BRT | Antarctica | -69.41°, 76.19° | Bozóki et al. 2023, Table 1 |
| Boulder Creek · BOU | United States | 37.19°, -122.12° | Bozóki et al. 2023, Table 1 |
| Eskdalemuir · ESK | United Kingdom | 55.29°, -3.17° | Bozóki et al. 2023, Table 1 |
| Fort Churchill · FCHU | Canada | 58.76°, -94.08° | Bozóki et al. 2023, Table 1 |
| Hofuf · HOF | Saudi Arabia | 25.94°, 48.95° | Bozóki et al. 2023, Table 1 |
| Hornsund · HRN | Svalbard, Norway | 77.00°, 15.60° | Bozóki et al. 2023, Table 1 |
| Hugo · HUG | United States | 38.89°, -103.40° | Bozóki et al. 2023, Table 1 |
| Hylaty · HYL | Poland | 49.19°, 22.55° | Bozóki et al. 2023, Table 1 |
| Kevo · KEV | Finland | 69.75°, 27.02° | Bozóki et al. 2023, Table 1 |
| Kilpisjärvi · KIL | Finland | 69.05°, 20.79° | Bozóki et al. 2023, Table 1 |
| Ministik Lake · MSTK | Canada | 53.35°, -112.97° | Bozóki et al. 2023, Table 1 |
| Mondy · MND | Russia | 51.60°, 100.90° | Bozóki et al. 2023, Table 1 |
| Northland · NOR | New Zealand | -35.11°, 173.49° | Bozóki et al. 2023, Table 1 |
| Patagonia · PAT | Argentina | -51.59°, -69.32° | Bozóki et al. 2023, Table 1 |
| Shillong · SHI | India | 25.60°, 91.90° | Bozóki et al. 2023, Table 1 |
| Sodankylä · SOD | Finland | 67.43°, 26.39° | Bozóki et al. 2023, Table 1 |
| Vernadsky · VRN | Antarctica (Ukraine) | -65.25°, -64.25° | Bozóki et al. 2023, Table 1 |
| Nagycenk · NCK | Hungary | 47.63°, 16.72° | Observatory coordinates |
| Sierra Nevada · SNV | Spain | 37.03°, -3.32° | UGR dataset record |
| Syowa / West Ongul · SYO | Antarctica (Japan) | -69.02°, 39.51° | MEXT observation programme, ELF site |
Selected stations and data access
The entries below identify documented measurements and their institutional or research sources. This is a selected directory, not a complete census or an uptime monitor. A linked station description establishes research provenance; it does not certify that a current public feed is online today.
Swipe or use the arrow keys to see all columns.
| Station or research location | Region | Documented work and access context |
|---|---|---|
| Hylaty | Poland | Jagiellonian University ELF station in the Bieszczady Mountains. Instrumentation and an older quick-look archive are public; archive access is not proof of current data. |
| Nagycenk / Széchenyi István Geophysical Observatory | Hungary | Electric and magnetic ELF observations. The observatory and display documentation explain the spectral and mode-parameter products. |
| Eskdalemuir | United Kingdom | The British Geological Survey documents induction-coil measurements and resonance research. Research description; current feed availability is not verified here. |
| Sierra Nevada | Spain | University research using ground magnetometers is documented in a four-year observational study. This is a research record, not a live dashboard. |
| Hugo, Colorado | United States | An ELF station described by Jagiellonian University’s WERA project. Current public stream availability is not asserted. |
| Patagonia, Río Gallegos | Argentina | The AGH University WERA account documents its 2016 installation as part of the array. |
| Syowa / West Ongul | Antarctica | Japan’s National Institute of Polar Research metadata documents search-coil observations of resonance-band signals. Data access follows the listed research contacts and archives. |
| Tomsk | Russia | Space Observing System 70 publishes a Tomsk sonogram and measurement notes. The public page was accessible during review; check the plot’s own date and time before treating it as current. |
Why the station location matters
A globally excited phenomenon is still measured locally. The instrument responds to particular field components at its own position. Nearby electrical equipment can add interference, and different lightning centers contribute differently to a station’s record.
Hylaty’s institutional description is especially useful: it explains the choice of a quiet site away from the power grid. That detail helps explain why a phone, a generic weather station or a bright social-media chart is not equivalent to a dedicated ELF observatory.
 Open figure at full size ↗
The instrument guide follows both magnetic and electric measurements from sensors through calibration to a spectrum. A map identifies places; it does not make every instrument or display directly comparable.
Why two graphs may disagree
Before calling two plots contradictory, compare their field component, units, frequency range, time zone, averaging window and color limits. One may show a magnetic spectrum, another an electric-field amplitude, and a third a derived index. The numbers do not become comparable just because every chart says “Schumann.”
A multi-station study can ask questions a single screenshot cannot. It can examine whether a feature appears in more than one record and whether differences fit the stations’ positions and instruments. That is a research workflow, not an invitation to average unrelated display values.
The additional mapped sites include Finland's pulsation-magnetometer stations, Canadian sites and Vernadsky in Antarctica. Their inclusion records their use in the cited research. It does not endorse every claim or product associated with an operator.
How to use and credit station data
Public access does not automatically authorize republication. Hylaty’s quick-look archive states conditions for scientific and educational use and asks other users to contact the group. Follow each provider’s terms; preserve the station, original timestamp and scale when quoting a result.
This directory links to sources instead of copying their live plots. Our learning figures are independently authored and labelled. For interpreting a downloaded chart, continue to the chart-reading guide.
Sources
The institutional and paper links in each directory row support that entry. Review date: 21 October 2026. Availability statements above describe this review, not continuous monitoring.
- Jagiellonian University: Hylaty instrument and site description.
- NIPR: Syowa ELF observation metadata.
- AGH University: the three-station WERA network.
- Bozóki and colleagues (2023): 18-station study, Table 1.
- Nagycenk: geographic coordinates.
- University of Granada: Sierra Nevada dataset and coordinates.
- MEXT: observation programme identifying the West Ongul ELF site.
- Natural Earth: public-domain map geometry.
Keep exploring
Make room for your own observations.
Schumann Pulse brings environmental readings and your personal journal into one place. The app is coming soon for iPhone.
Explore the app