
The field guide · Sun
How do we monitor space weather?
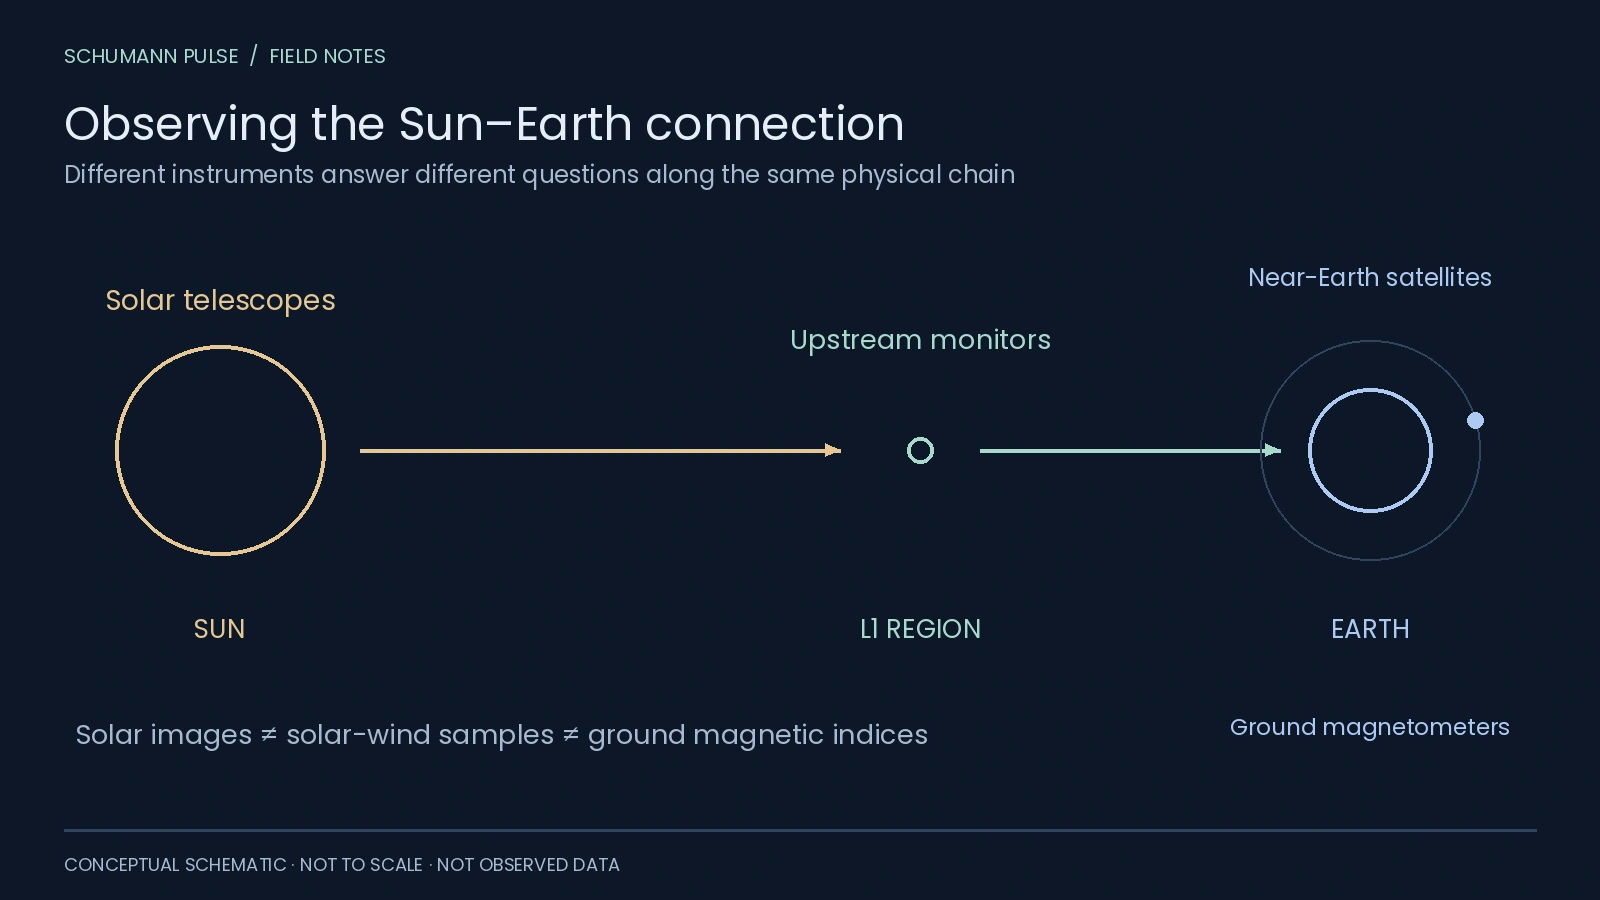
Space-weather monitoring combines solar images, upstream solar-wind measurements, near-Earth particle and radiation instruments, and ground magnetic observations. No single observatory sees the whole chain from a solar eruption to its effects at Earth.
 Open figure at full size ↗
Observe the source: the Sun
NASA’s Solar Dynamics Observatory studies the Sun and its changing activity. Different wavelengths reveal different structures and temperatures. An ultraviolet image is often displayed with assigned colors so features can be distinguished; it is not what an unaided eye would see.
The archival film below comes from SDO/AIA 304 observations on 1 July 2013. The date and instrument are part of the image’s meaning, even when it is reused years later to explain solar behavior.
Observe what is heading toward Earth
The Sun–Earth L1 region lies upstream of Earth in the solar wind. Measurements there can reveal changes before they reach Earth’s immediate environment. ESA’s sensor overview explains this observing geometry.
DSCOVR is a documented example of this mission class; NASA describes its solar-wind role and L1 location. This is not a claim that it is always the current primary feed. NOAA’s solar-wind product lets users inspect sources and explains that its primary spacecraft can change.
Observe the near-Earth environment
NOAA’s GOES instruments provide measurements used in X-ray flare and energetic-particle reporting. The value of these records comes from the specified energy or wavelength band, calibration and event time, not just the satellite name.
For example, a flare class uses soft X-ray flux, while an S-scale radiation storm uses an energetic-proton measurement. They require different sensors and cannot be reconstructed from the same attractive solar image.
Observe Earth’s magnetic response
INTERMAGNET coordinates a worldwide network of geomagnetic observatories and provides information about data quality and exchange. GFZ’s Kp documentation identifies the 13 observatories used for its planetary index.
A broad global network and the particular network used to produce one index are not identical lists. Nor is a geomagnetic observatory automatically a station publishing Schumann resonance measurements. The Schumann observatory directory covers that distinct instrumentation.
How did observers work before satellites?
In 1859, Carrington and Hodgson independently recorded a brief white-light solar brightening. Their observations and contemporary ground records are historical evidence; modern solar-wind measurements were not available. The Carrington event story separates direct observations from later reconstructions.
Spacecraft opened additional observing positions, rather than replacing all ground instruments. A different example is the C/NOFS detection of Schumann signatures: an electric-field instrument in the ionosphere answered a question that a solar camera could not.
Which source answers which question?
Swipe or use the arrow keys to see all columns.
| Your question | Start with |
|---|---|
| What structure is visible on the Sun? | Dated solar images with wavelength labels |
| Has an upstream disturbance arrived at a monitor? | Solar-wind product with spacecraft and time |
| What was the X-ray flare class? | The X-ray event report |
| How disturbed was Earth’s magnetic environment? | A geomagnetic index with its interval |
| What is expected next? | An official forecast and its issue time |
Sources
- NASA: Solar Dynamics Observatory.
- NASA: DSCOVR mission.
- NOAA SWPC: source selection in the solar-wind product.
- INTERMAGNET: international observatory network.
- GFZ: Kp contributing observatories.
Keep exploring
Make room for your own observations.
Schumann Pulse brings environmental readings and your personal journal into one place. The app is coming soon for iPhone.
Explore the app