
The field guide · Sun
How to read the solar wind.
The solar wind is a continuous outflow of plasma from the Sun, carrying a magnetic field. Speed, density and magnetic-field direction describe different aspects of it. Faster wind can matter, but speed alone does not determine geomagnetic-storm strength.
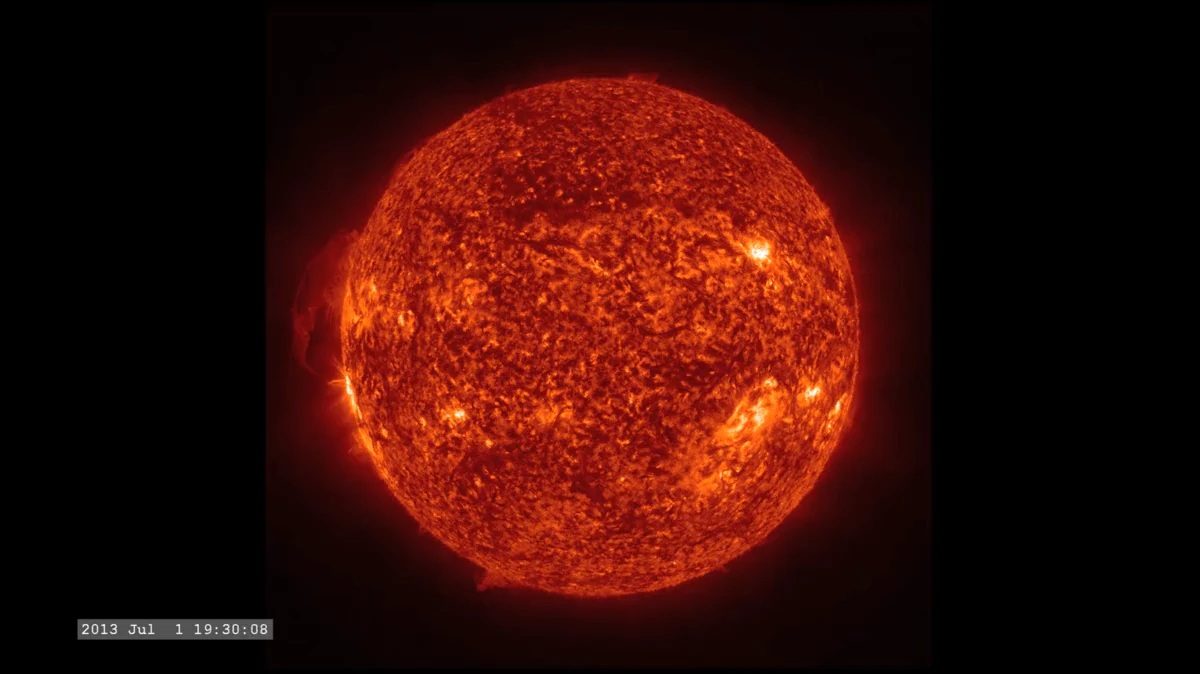
The Sun’s continuous outflow
Unlike a brief eruption, the solar wind is always flowing. It consists mainly of protons and electrons. Different solar regions produce streams with different properties. NOAA’s solar-wind introduction describes slow wind around 400 km/s and fast streams associated with coronal holes that can reach roughly 500–800 km/s.
Those ranges are context, not a rule for classifying every observation. Disturbed solar-wind conditions can fall outside a simple quiet-versus-fast picture.
Four labels worth knowing
Swipe or use the arrow keys to see all columns.
| Label | Typical unit | What it describes |
|---|---|---|
| Speed | km/s | How quickly the plasma is moving |
| Density | particles/cm³ | How many particles occupy a volume |
| Bt | nT | Total magnetic-field magnitude |
| Bz | nT | One directional component of the field, in the stated coordinate system |
Read the product’s coordinate-system label. Bz is not a second version of total field strength, and a negative sign is not the same as a missing measurement.
Why southward Bz attracts attention
A southward interplanetary magnetic-field component can support more effective energy transfer into Earth’s magnetosphere. NOAA’s storm guidance emphasizes sustained conditions, rather than one isolated sample.
In the commonly used GSM coordinates, negative Bz indicates a southward component. Interpretation still needs the field magnitude, speed and duration. A one-minute negative excursion and a prolonged interval are different situations even if their minimum values match.
What an upstream monitor can and cannot tell you
Measurements near the Sun–Earth L1 region sample the solar wind before it reaches Earth. ESA describes L1 as an upstream observing location. The lead time depends on the flow and geometry; an instrument timestamp is not automatically the time the same structure affects Earth.
For a current product, inspect the source spacecraft, data age and any propagation convention. Operational sources can change, so use the product’s own metadata rather than assuming one satellite always supplies it.
A reading sequence that preserves context
Start with the time and data quality. Read speed and density, then the magnetic-field magnitude and direction. Look at how long a change persists. Finally compare with an observed geomagnetic index or official bulletin.
Avoid constructing a private “storm score” by adding unrelated units. A plot that sums speed, density and Bz without a defined physical model can look authoritative while having no interpretable scale.
Sources
- NOAA SWPC: solar wind.
- NOAA SWPC: geomagnetic-storm drivers.
- ESA: upstream space-weather measurements.
Keep exploring
Make room for your own observations.
Schumann Pulse brings environmental readings and your personal journal into one place. The app is coming soon for iPhone.
Explore the app