
The field guide · Sun
What is a solar radiation storm?
A solar radiation storm is an elevated energetic-particle event, classified by NOAA from S1 to S5 using proton measurements. It is different from a geomagnetic storm on the G scale and a flare-related radio blackout on the R scale.
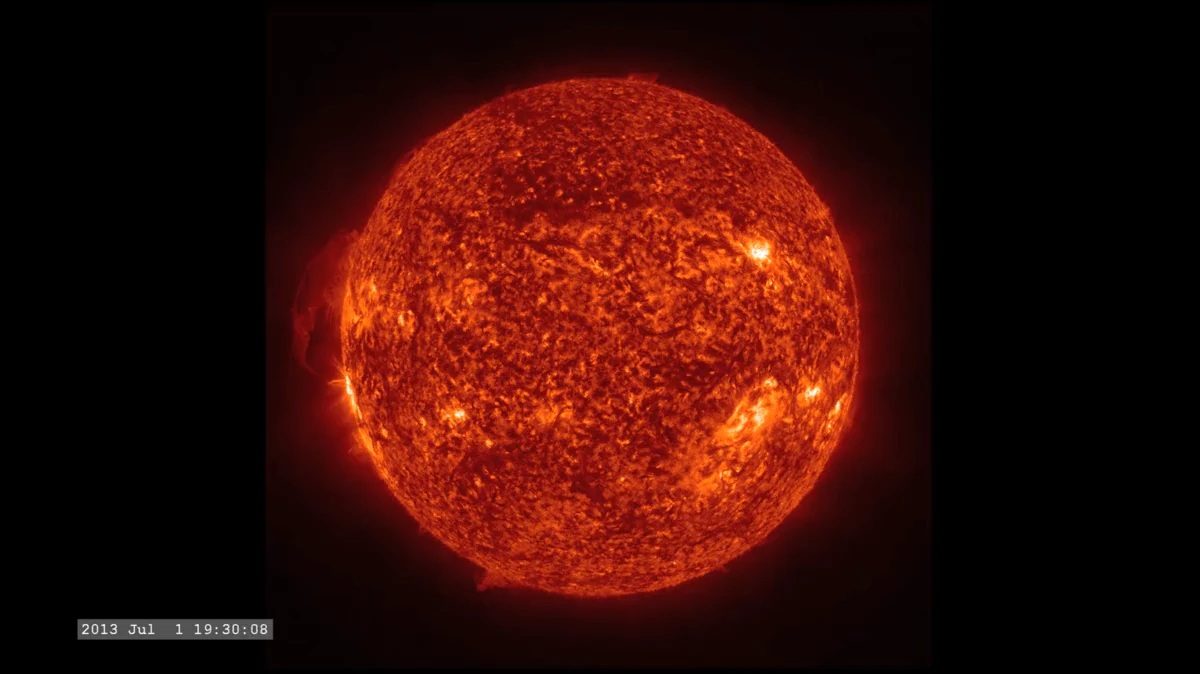
What is being measured?
Solar eruptions can accelerate charged particles to high energies. NOAA’s S scale uses the flux of protons with energies of at least 10 MeV. The S1 threshold is 10 proton flux units, or pfu. A pfu expresses particles per square centimeter, per second, per steradian.
NOAA’s radiation-storm explanation describes these measurements and their relationship to GOES observations. This is a particle-flux quantity, not an X-ray flare class or a magnetic-field strength.
The five S levels
Swipe or use the arrow keys to see all columns.
| Level | Name | Proton flux threshold, ≥10 MeV |
|---|---|---|
| S1 | Minor | 10 pfu |
| S2 | Moderate | 100 pfu |
| S3 | Strong | 1,000 pfu |
| S4 | Severe | 10,000 pfu |
| S5 | Extreme | 100,000 pfu |
These thresholds classify the measured environment. They do not directly specify a person’s absorbed dose. The full NOAA scale describes possible effects in the relevant settings.
Why the distinction matters
Radiation-storm products are particularly relevant to space operations, spacecraft electronics and some polar or high-altitude aviation contexts. They should not be translated into a universal claim that everyone at ground level is experiencing the same exposure.
For operational decisions, use the appropriate official product and qualified procedures. A general educational page cannot replace spacecraft, airline or radiation-protection guidance.
Particle arrival is not CME arrival
Energetic particles and a CME’s bulk plasma are different parts of a solar event. They do not have to arrive together. A radiation-storm alert is therefore not proof that the main CME cloud has already reached Earth.
Likewise, a high X-ray flare class is not a conversion formula to an S level. Read the actual proton product for the particle event and the relevant magnetic index for Earth’s geomagnetic response.
How to read a particle plot
Check the energy threshold, units, time range and whether the plot uses a logarithmic axis. Multiple traces may represent different particle-energy channels. Comparing their heights without the legend can compare unlike quantities.
If a data stream has a gap, preserve it as missing. An absent measurement does not establish that particle flux fell to zero. The same principle appears in our chart-reading guide, even though the instruments and physical quantities are different.
Sources
Keep exploring
Make room for your own observations.
Schumann Pulse brings environmental readings and your personal journal into one place. The app is coming soon for iPhone.
Explore the app