Space weather today.
Follow the latest estimated Kp index, see how today compares and understand what the numbers actually mean.
Running Kp estimate
This estimate can change. The chart and saved cards below use completed three-hour intervals.
Below geomagnetic storm level
Latest completed interval
Below geomagnetic storm level
21 Oct 2026 · interval start
The latest interval shown is below NOAA’s geomagnetic storm threshold. This does not predict the next interval or local aurora visibility.
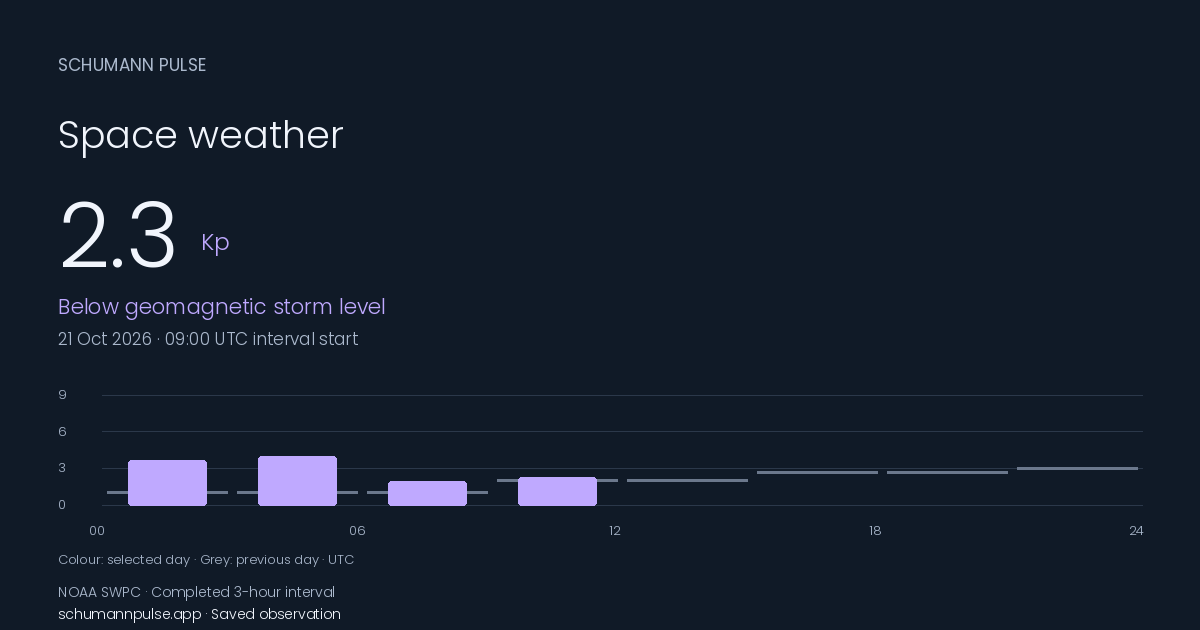
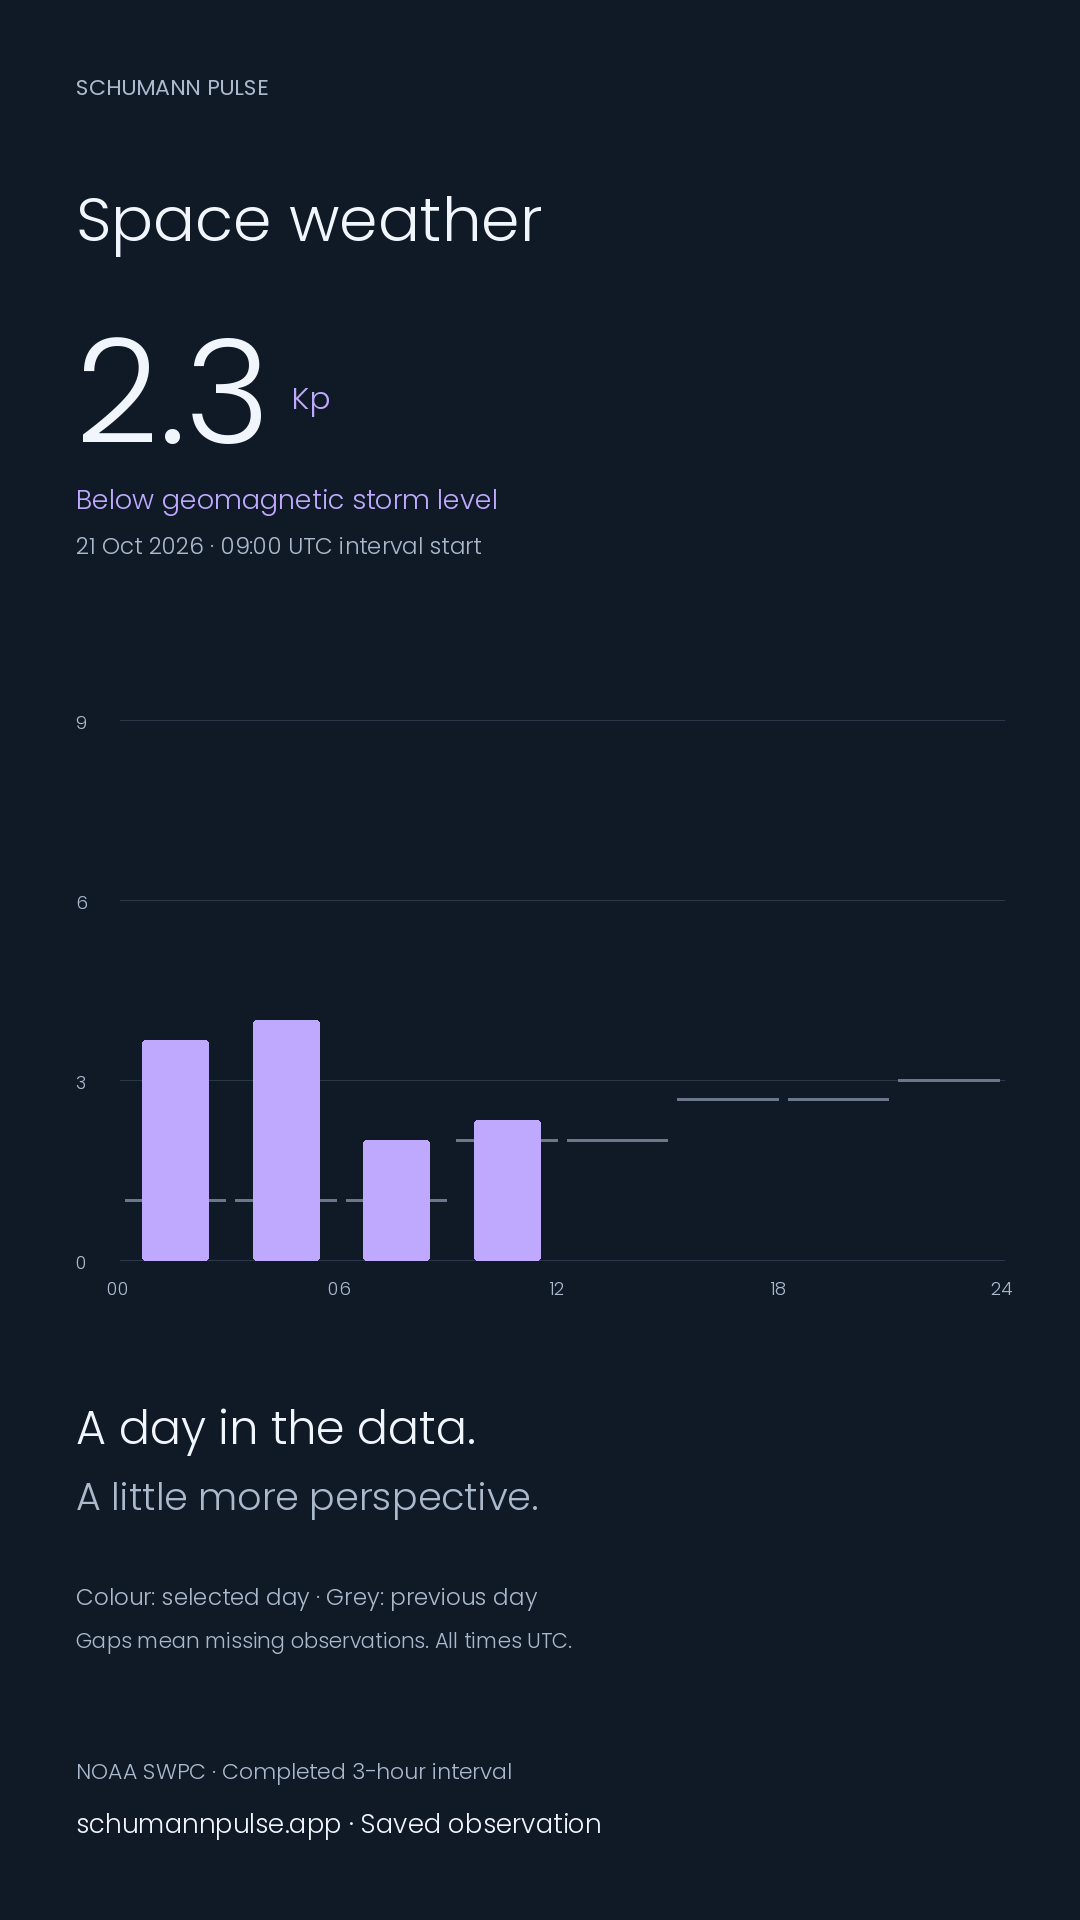
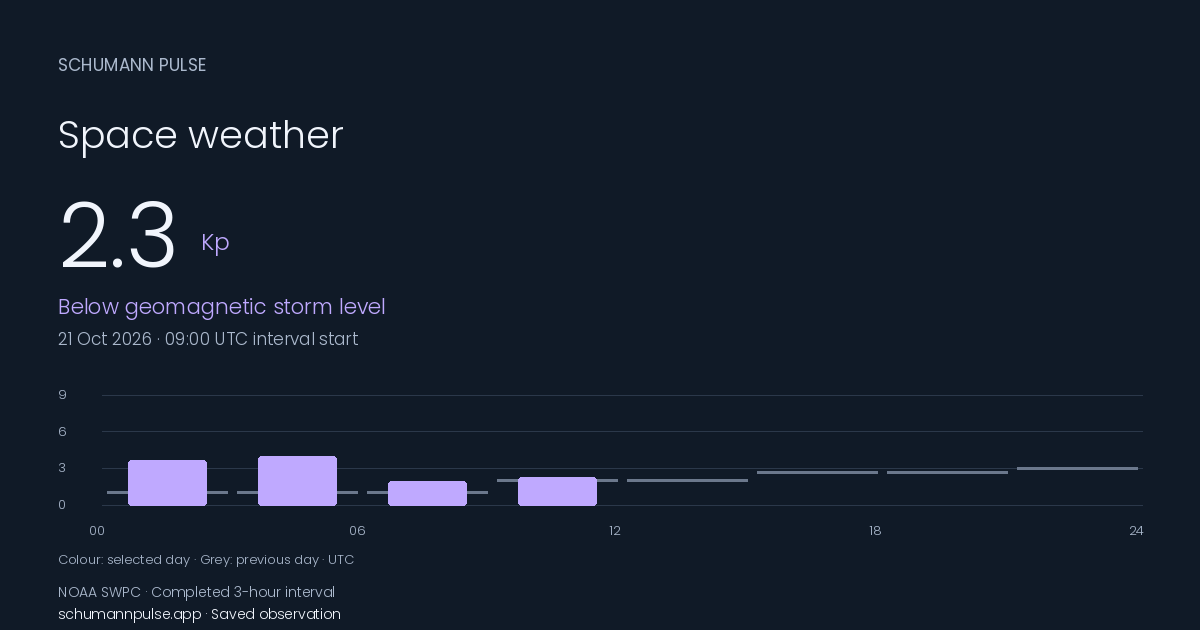
Completed three-hour intervals 21 Oct 2026
Maximum so far
4.0KpCompared with previous day
+1.8 Kp4 matched three-hour intervals · mean differenceThe storm threshold
5.0Kp · Minor / G1Estimated index · NOAA SWPC ↗
Source estimates can be revised.
The planetary Kp index estimates disturbances in Earth’s magnetic field. Each bar represents a three-hour interval.
Read the chart guide ↗What is the Sun doing?
GOES measures solar X-ray flux in the 0.1–0.8 nm band. This is separate from Kp and is not a forecast.
View observations as a table
| Time | Kp | Previous day, same time |
|---|---|---|
| 00:00 | 3.67 | 1 |
| 03:00 | 4 | 1 |
| 06:00 | 2 | 1 |
| 09:00 | 2.33 | 2 |
Send a little perspective.
Share this dated completed-interval chart. The chart and numbers stay with the link, even after today moves on.
 Schumann Pulse for iPhone
A little context.
With you through the day.
Keep observations close, choose activity alerts and build a journal of your own day. Explore comparisons as your history grows.
Go beyond the number.
What the Kp index tells you ↗
The scale, the three-hour window and why a planetary index is not your local sky.
02 / The meaningGeomagnetic storms, explained ↗
From a minor G1 storm to extreme G5: the different levels and their effects.
03 / The SunSolar flares and X-ray classes ↗
Why a flare, a coronal mass ejection and a geomagnetic storm are different events.
What you are looking at.
NOAA SWPC estimates planetary Kp using ground-based magnetometer observations. Each bar covers a three-hour UTC interval and can be revised. The running estimate is shown separately with its own update time. The chart, day comparison and saved cards use completed three-hour intervals, labelled by their start time. Neither series predicts the next interval.
We check for updates every five minutes. The comparison uses only intervals present on both days, so a partial day is not compared with an entire day. Gaps remain gaps. Solar X-ray flux is shown separately with its own timestamp.
These are environmental observations. They cannot establish why you feel a certain way or whether aurora will be visible at your location.
NOAA Kp methodology ↗ · NOAA storm scales ↗ · Our source standards