Schumann resonance today.
Explore Tomsk, Nagycenk and Etna. Follow numeric observations where available, read source spectrograms and understand what each station measures.
One Earth.
Different perspectives.
Explore the signal from different instruments. Each station tells a local story.
Meet the observatories ↗EtnaNicolosi · Sicily
A different view of the same resonant cavity. The EC200 induction coil records magnetic signals; the source image shows eight hours of ELF and ULF activity.
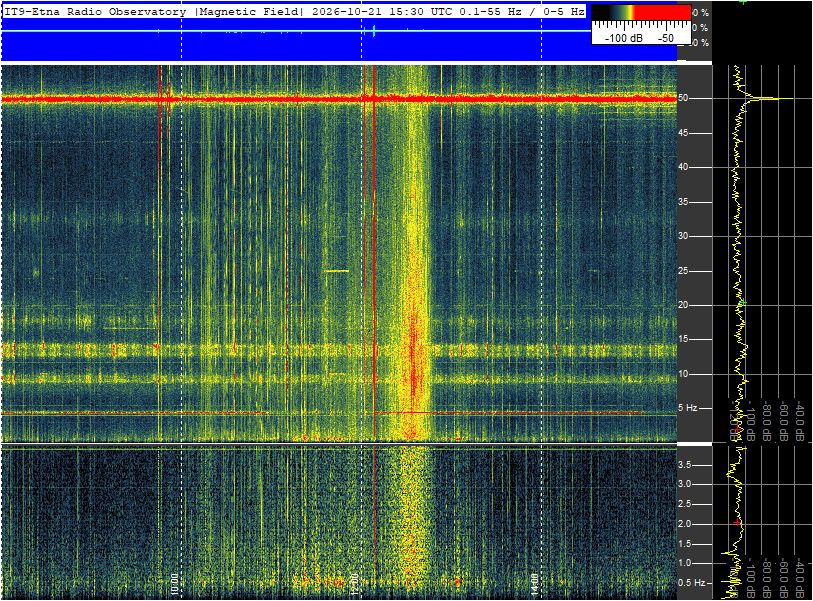
Measurement times are printed on the image. Retrieval time only tells you when we downloaded it; it does not confirm that the measurements are current.
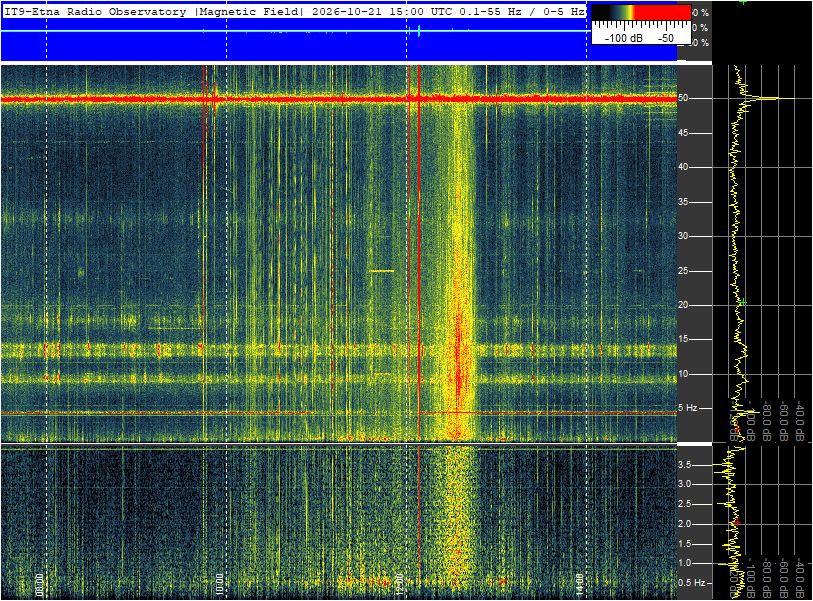
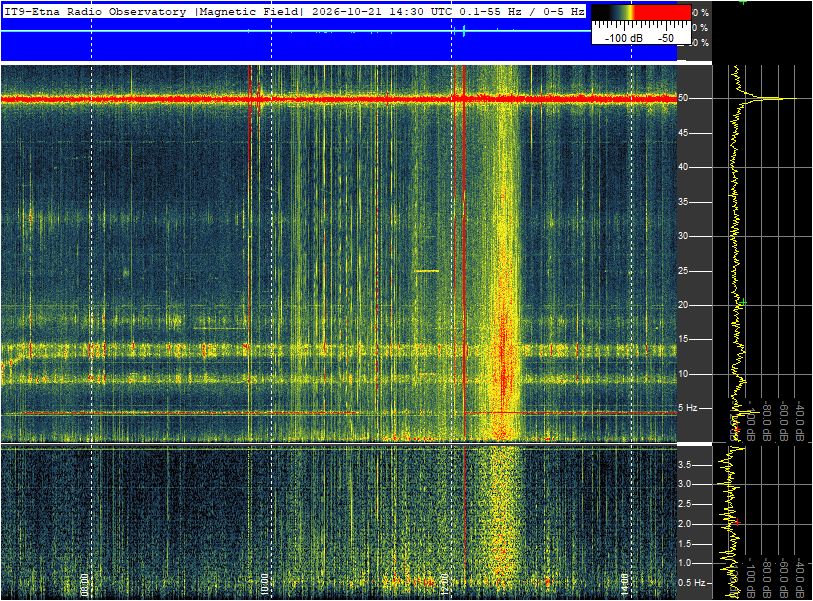
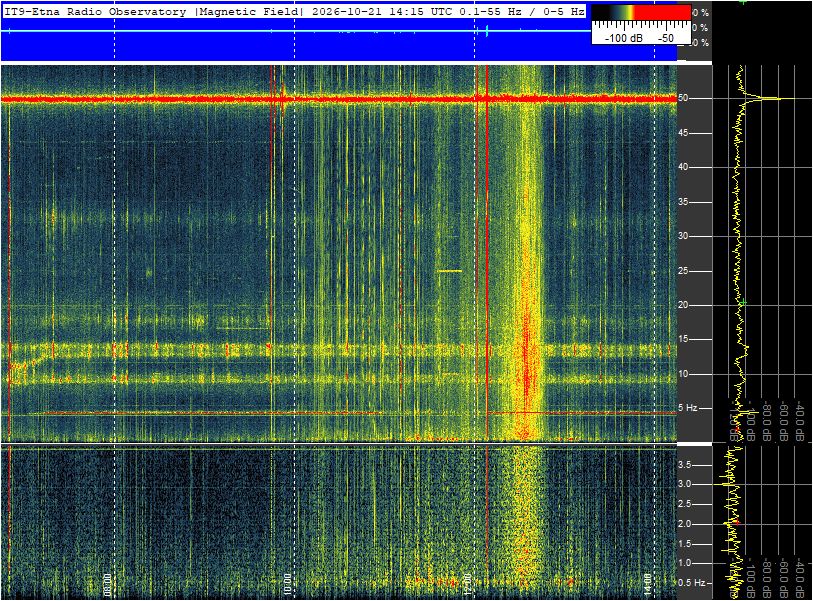
Earlier saved source images 4 captures
Listed by first retrieval time, not measurement time. Images may cover overlapping intervals.
Read the spectrum
Horizontal bands mark persistent frequency structure. Colours describe the strength shown on the source scale, not a universal “Earth frequency”. This image is not directly comparable with Tomsk’s A1 values.
About this connection
We reproduce the complete source image with attribution under ERO’s published terms. A machine-readable numerical feed and its reuse conditions have not yet been established.
Source and reuse terms ↗Explore Etna: instruments, history & chart guide ↗
Source: Etna Radio Observatory ↗
 Schumann Pulse for iPhone
A little context.
With you through the day.
Keep observations close, choose activity alerts and build a journal of your own day. Explore comparisons as your history grows.
Read the signal with confidence.
Amplitude is not frequency ↗
Read axes, colours and missing periods without turning every bright band into a claim.
02 / The scienceWhy Earth has resonances ↗
Lightning, the Earth–ionosphere cavity and the often-quoted 7.83 Hz fundamental.
03 / The stationsA world of listening stations ↗
Explore documented research locations and the different instruments behind the observations.
Different stations. Different measurements.
Schumann resonances are electromagnetic resonances of the Earth–ionosphere cavity, mainly excited by lightning. A station measures a local signal shaped by global activity, propagation, local interference and its instruments.
Amplitude describes signal strength. Frequency, measured in hertz, describes the position of a resonance peak. The often-quoted 7.83 Hz is an approximate reference for the first mode, not a live reading or a fixed number for every moment. Different instruments and source units mean the stations’ amplitudes should not be combined into a global score.
For Tomsk, we draw original charts from subscribed numeric observations, using five-minute averages of samples around each timestamp. Times are converted to UTC. The comparison uses matching times on both days; missing observations remain gaps. A reading more than 90 minutes old is marked delayed. Etna provides an attributed source spectrogram; Nagycenk’s display is linked at the observatory. Neither has a numerical feed connected here yet.
Understand the frequencies ↗ · Our source standards