
The field guide · Earth
Schumann resonance at Etna Radio Observatory
Etna Radio Observatory publishes magnetic-field spectrograms from Nicolosi, Sicily. Its EC200 induction coil records extremely low-frequency signals, including the Schumann resonance bands. The display is an instrument’s local record, with its own time range and scale.
 Open figure at full size ↗
Where is Etna Radio Observatory?
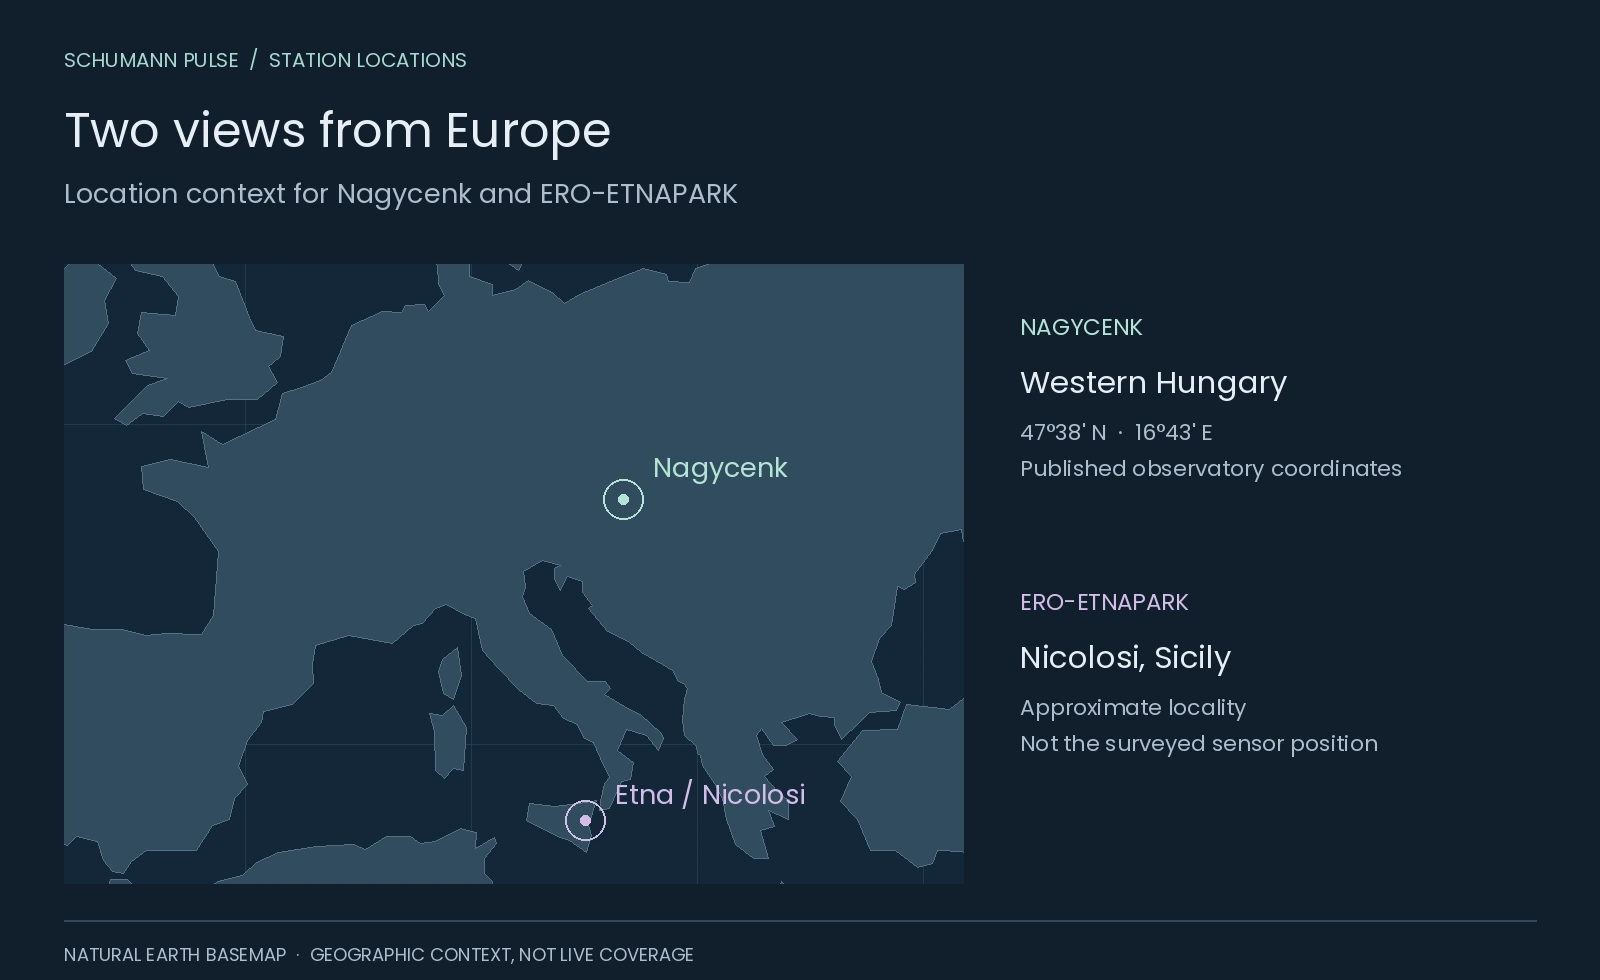
ERO-ETNAPARK is in Nicolosi, Sicily, at Etna Park. The operator identifies the station as maintained by the ERO team. Our map marks the Nicolosi locality approximately; it does not claim to locate the sensor precisely. Station and instrumentation page [1].
Open Etna observations for the complete source spectrogram and earlier saved images. The date printed inside a plot describes the recorded interval; our retrieval timestamp says when we saved that image.
How did the project begin?
Rosario Catania’s project account traces the beginning to 2013, when he used an antenna built by Alessandro Longo to investigate natural radio signals. Renato Romero contributed low-frequency expertise, and Etna Park hosted the station. The result is a useful example of instrument building and independent research working together. ERO project history [2].
There is an intriguing question behind the location: could nearby volcanic activity leave a recognisable electromagnetic signature? ERO’s account describes that as an investigation. It also says its comparison had not established a correlation between volcanic tremor and the low-frequency magnetic record. The page is not evidence of a working eruption forecast. The project’s stated results and limitations [2].
What is the EC200 coil?
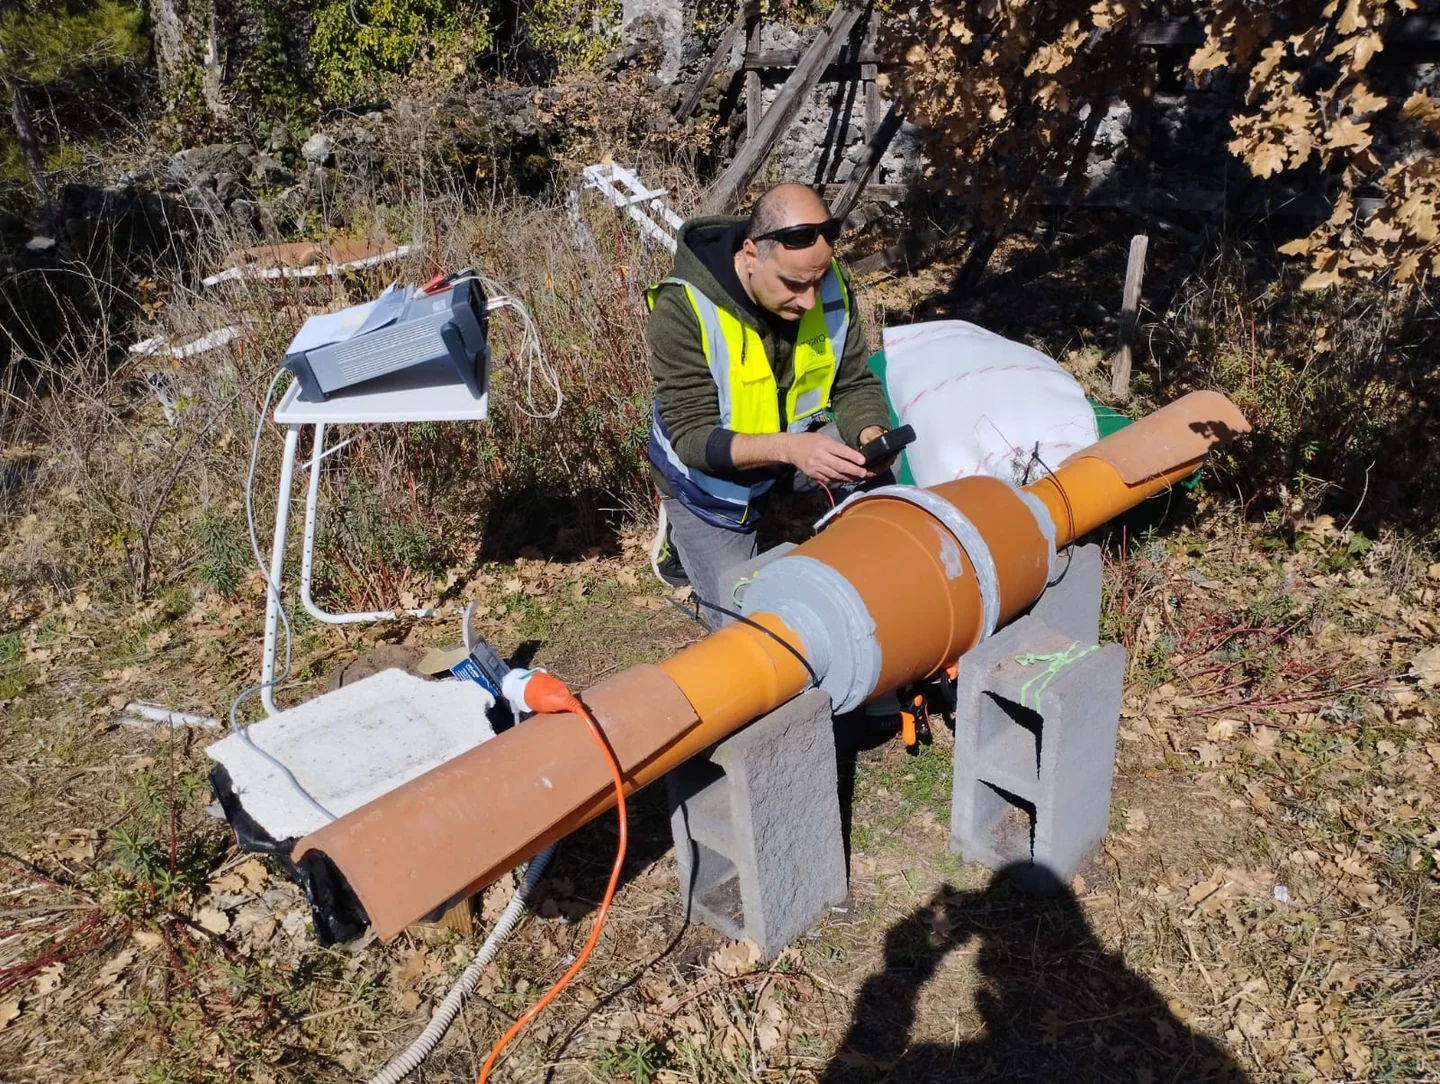
The instrument in the photograph is ERO’s EC200 induction coil. Its specification lists about 30 km of copper wire in two series-connected windings around an iron core, with a total assembly mass of 97.4 kg. An amplifier feeds a computer sound-card input. EC200 specifications [1].
This is a magnetic receiver. It is not a microphone listening to audible sound, and its photograph shows why an optical telescope would be a misleading illustration of this measurement. Our sensor guide explains the route from changing fields to recorded signals and spectra.
How do I read the Etna spectrogram?
ERO describes an eight-hour coil display, with Schumann bands marked at the right and a lower panel zooming into 0.1–4 Hz. The operator also provides one-hour and daily strips. Display descriptions [1].
Use this reading sequence when opening a plot:
- Read the time labels. Confirm the observation date and interval before comparing screenshots.
- Find the frequency axis. A horizontal band occupies a frequency range; it is not a new daily value for Earth’s entire resonance.
- Read the colour scale. Colour encodes the plotted signal level. A white or bright region needs the scale and surrounding context to be interpretable.
- Check continuity. Missing or interrupted recording is different from a physically quiet interval.
Those are chart-reading steps, not an interpretation of today’s image. The illustrated spectrogram guide walks through labelled examples. The Etna image cannot be overlaid as though it were Tomsk’s numerical A1 curve.
What can I explore on Schumann Pulse?
Swipe or use the arrow keys to see all columns.
| Available now | Where to look |
|---|---|
| Complete attributed EC200 source image | Etna station view |
| Earlier saved source images | “Earlier saved source images” in that view, when more than one capture exists |
| Station context and map | The station explorer and the map below |
| Numerical day-to-day comparison | Not connected for Etna |
Saved images can overlap in time, and retrieval does not guarantee a newly updated measurement. We preserve the source chart rather than estimating numerical observations from its colours. No machine-readable public numerical feed has been established in this review.
 Open figure at full size ↗
For another European station with a different measurement setup, explore Nagycenk’s electric and magnetic observations. The distinction between those components matters more than whether two pictures look similar.
Sources
References in the text lead here. Original publications open in a new tab; this guide stays open.
Source review: 21 October 2026. The instrument photograph is documentary material, not an image of current conditions.
- [1] ERO-ETNAPARK: station, EC200 photograph, specifications and displays (opens in a new tab) First mention ↑.
- [2] Rosario Catania / ERO: project history and experimental limits (opens in a new tab) First mention ↑.
- [3] ERO reproduction terms (opens in a new tab): reproduction with full source attribution.
- [4] Natural Earth: public-domain map geometry (opens in a new tab).
Keep exploring
Make room for your own observations.
Schumann Pulse brings environmental readings and your personal journal into one place. The app is coming soon for iPhone.
Explore the app