
The field guide · Wellbeing & evidence
Does Schumann resonance affect your health?
Schumann resonance is a real electromagnetic phenomenon, but a station's readings are not a validated test for fatigue, headache, anxiety or sleep problems. Studies of artificial devices ask a different question from studies of natural environmental exposure. Sharing a frequency does not establish a health effect.

Start with what a Schumann station measures
Lightning excites electromagnetic resonances in the space between Earth's surface and the ionosphere. The lowest mode is near 7.8 Hz, with additional modes at higher frequencies. NASA's explanation [1] describes the physical phenomenon; our introductory guide explains frequency, amplitude and the observing instruments.
A station records a local electric or magnetic signal. Its chart does not measure your brain, sleep, stress or symptoms. A bright area on a spectrogram describes signal strength in the plotted quantity and frequency range, subject to the station's scale and data quality.
This matters for searches such as “Schumann resonance symptoms today.” The chart can answer what that instrument recorded. It cannot identify why a person feels different.
Natural fields, devices and audio are different exposures
Swipe or use the arrow keys to see all columns.
| What is being discussed? | What would need to be established? |
|---|---|
| Natural environmental resonance | The field measured, its strength, location and timing, and a defensible relationship to an outcome |
| An artificial electromagnetic device | The device's actual output, exposure conditions, comparison treatment and replicated outcomes |
| Music or an audio track labelled 7.83 Hz | The acoustic stimulus and the outcome tested; a label is not a measurement of Earth's electromagnetic field |
A similar frequency number does not make these interventions equivalent. Frequency alone leaves out strength, waveform, duration and the way an exposure reaches a person. An audio track is not a recording of the electromagnetic field simply because its title says “Schumann.”
What did the insomnia device study find?
A 2022 randomized, double-blinded study [2] compared a sleep device with a placebo device over four weeks; 40 participants with insomnia completed the study. The authors reported improvements in several sleep measures within the active group, while some subjective measures also improved in the placebo group.
Improvement within one group is not, on its own, proof that its improvement exceeded the comparison group's. The abstract's positive conclusion should be read alongside the individual outcomes, short follow-up and small sample. The disclosure states that an author held the device's patent license. A linked corrigendum [3] is part of the publication record.
This experiment tested a particular device. It did not test whether a natural station spike causes symptoms or whether a commercial audio track treats insomnia. Those would require separate evidence. We do not use it to recommend a device or treatment.
Does 7.83 Hz mean the brain is synchronizing with Earth?
A numerical overlap between frequency ranges is not enough to demonstrate coupling. To support that claim, an experiment would need to show a measured response under specified exposure conditions and rule out other explanations. To establish a health benefit, it would then need to show a meaningful clinical outcome.
These are separate steps. Moving directly from “a natural resonance exists” to “it improves your sleep” skips the evidence needed between them. The same applies to claims that a higher station amplitude must produce worse symptoms.
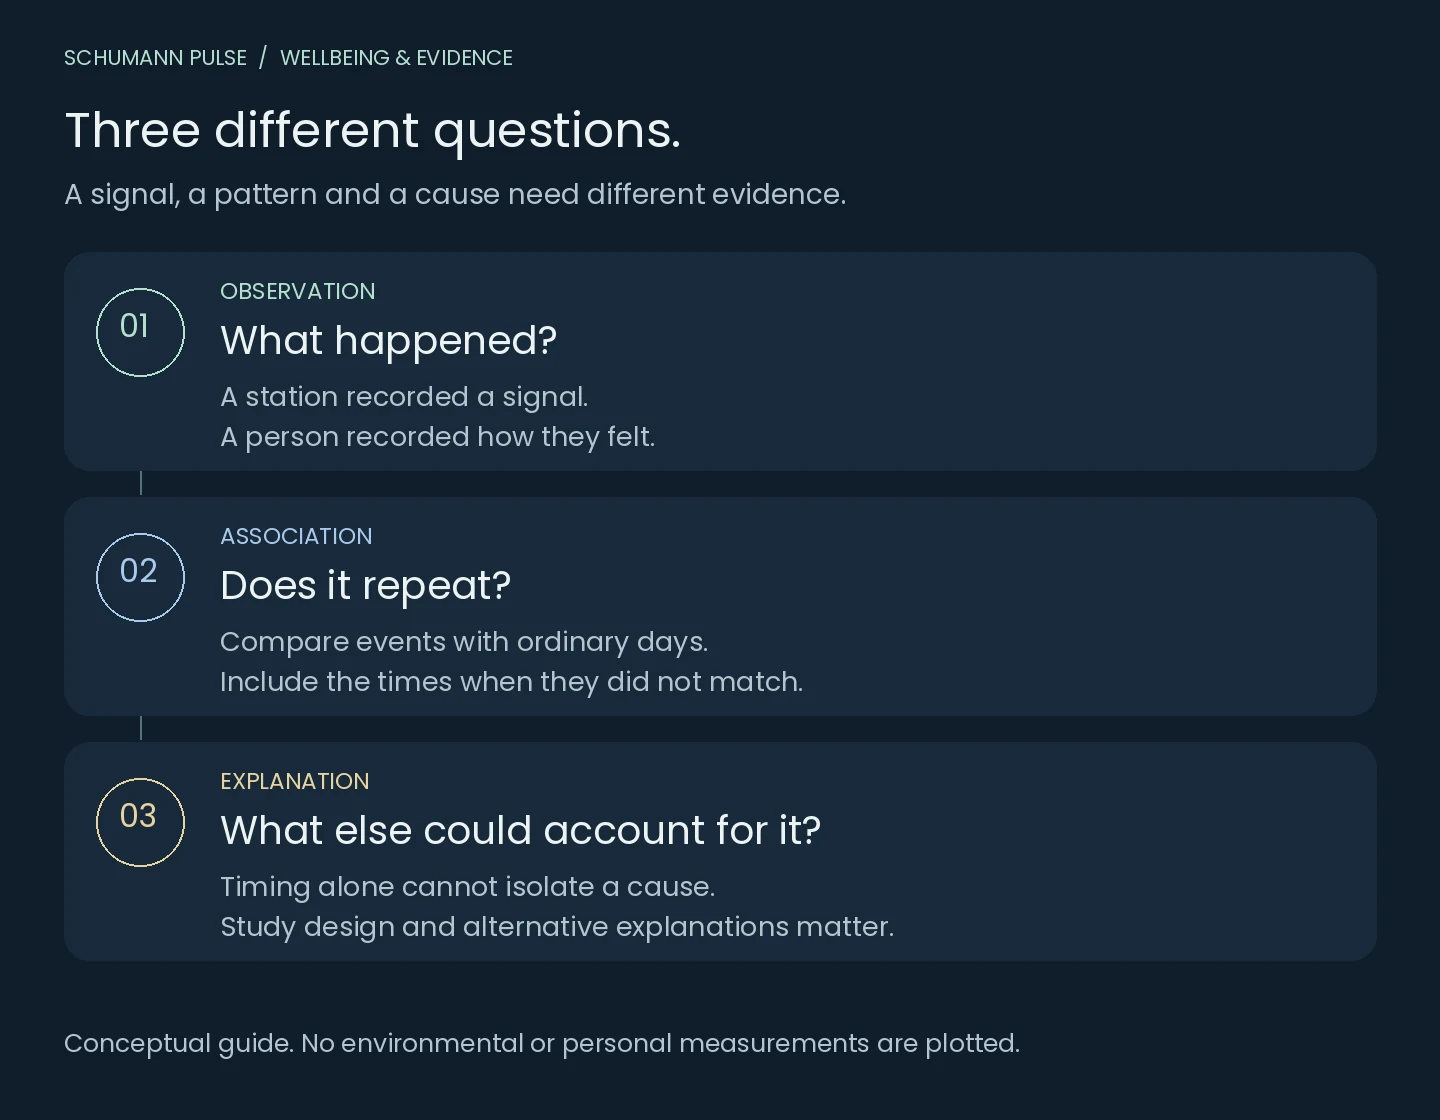 Open figure at full size ↗
How to examine a possible personal pattern
If you notice a coincidence, keep it as a question rather than a conclusion. Record the symptom and time before examining the plot. Include days when you feel well, and distinguish a data gap or delayed update from a low reading.
Use one consistent station and measurement for a comparison. Switching stations or scales because another chart better matches a difficult day changes the question after seeing the result. Our chart-reading guide explains the common measurement mistakes.
Schumann Pulse places journal entries alongside environmental context and offers comparisons when suitable history exists. It does not diagnose resonance sensitivity. The tracking guide explains a practical method, while Schumann resonance today identifies each station and its available data.
Sources
References in the text lead here. Original publications open in a new tab; this guide stays open.
- [1] NASA Goddard: Schumann resonance (opens in a new tab) Back to text ↑, physical mechanism and observations.
- Huang et al. (2022), [2] The Subjective and Objective Improvement of Non-Invasive Treatment of Schumann Resonance in Insomnia—A Randomized and Double-Blinded Study (opens in a new tab) Back to text ↑, Nature and Science of Sleep. DOI: 10.2147/NSS.S346941.
- [3] Corrigendum to Huang et al. (opens in a new tab) Back to text ↑ (2022), DOI: 10.2147/NSS.S380174.
This is an editorial review of selected evidence, not a systematic review or a clinical assessment. See our health evidence standards.
Keep exploring
Make room for your own observations.
Schumann Pulse brings environmental readings and your personal journal into one place. The app is coming soon for iPhone.
Explore the app