Space weather.
A moment, saved.
A dated observation, kept just as it was shared. See the source, read the chart and explore what came before.
Saved observation
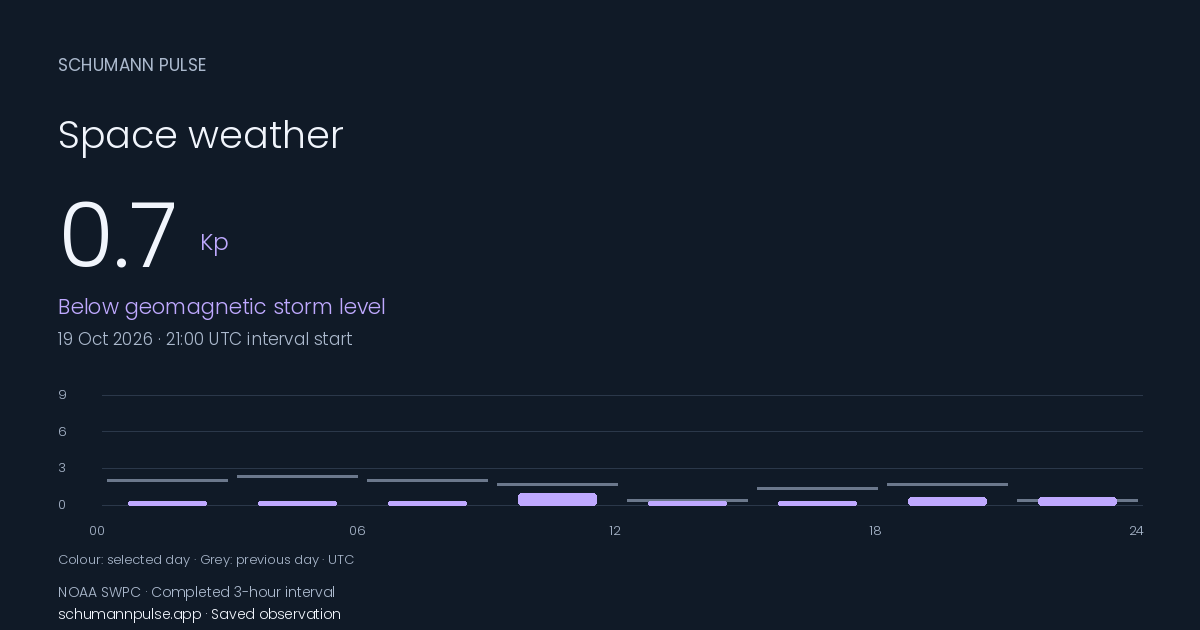
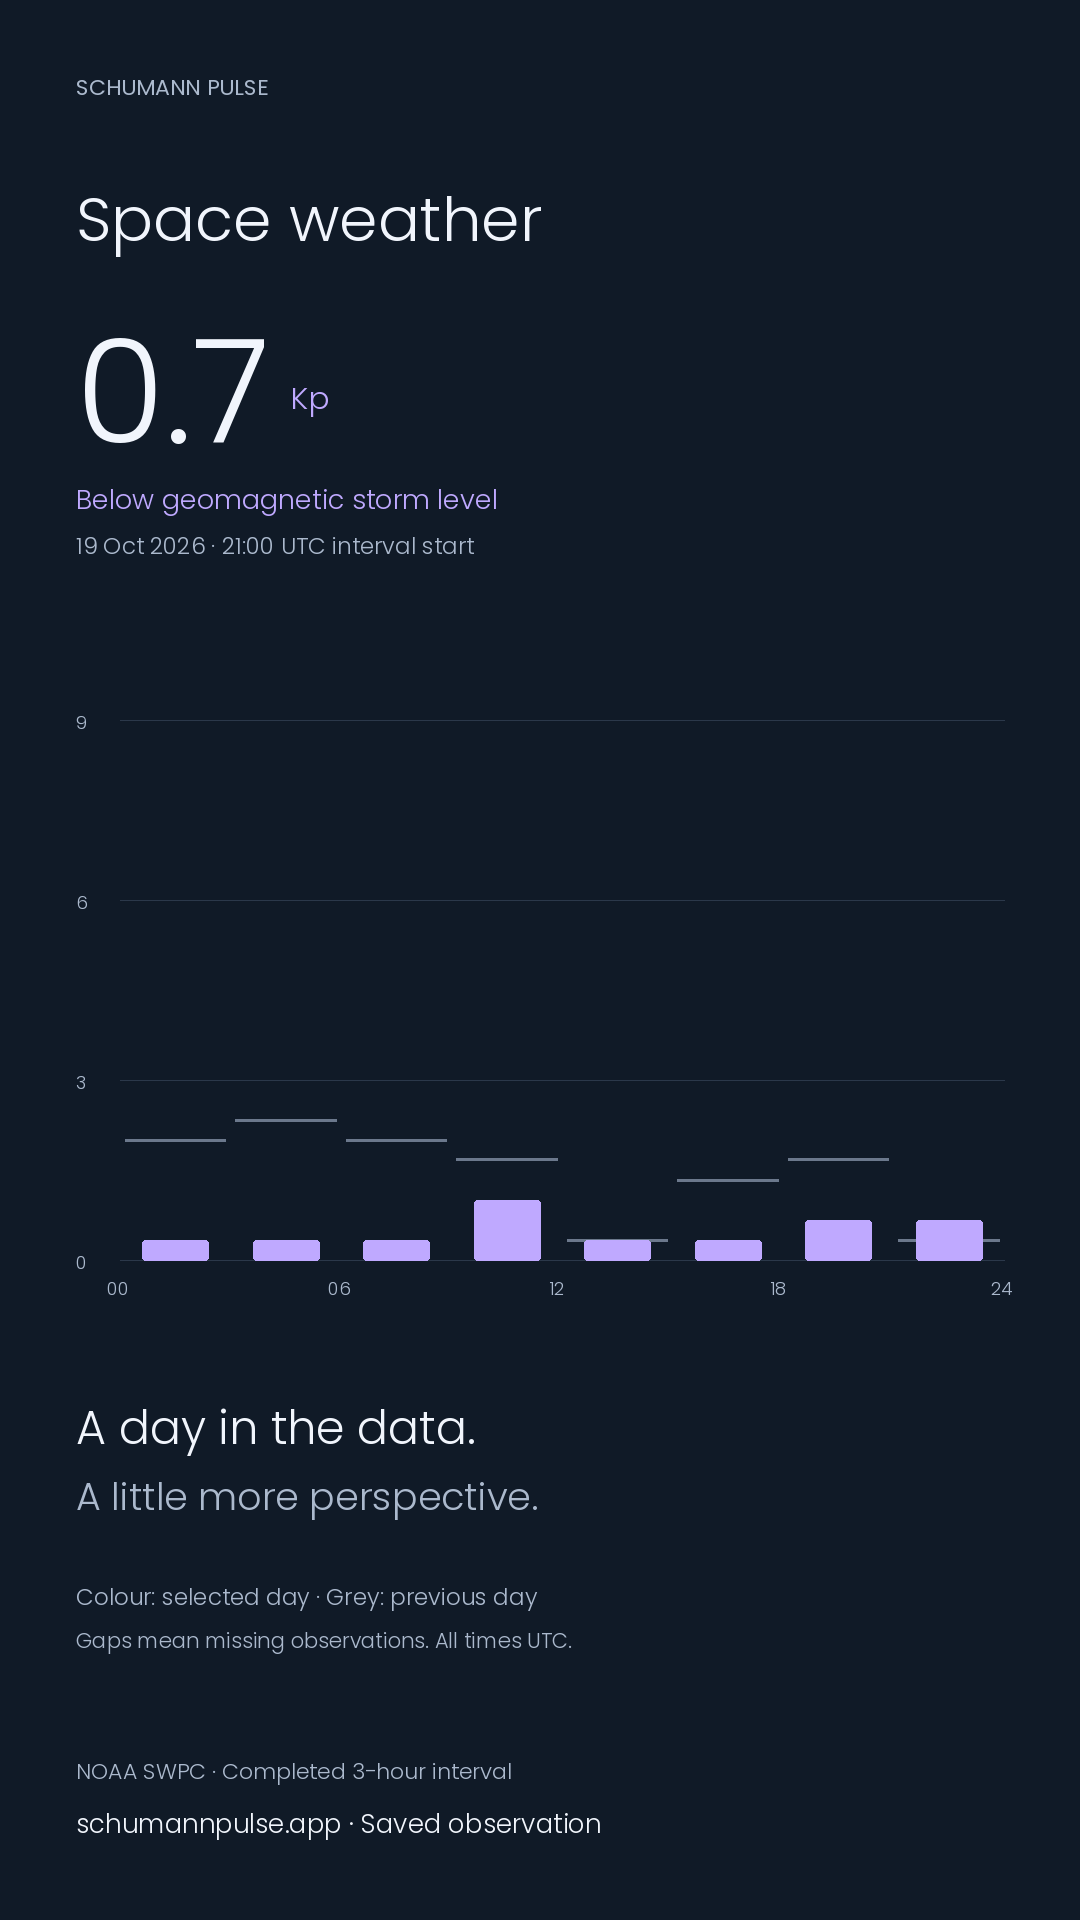
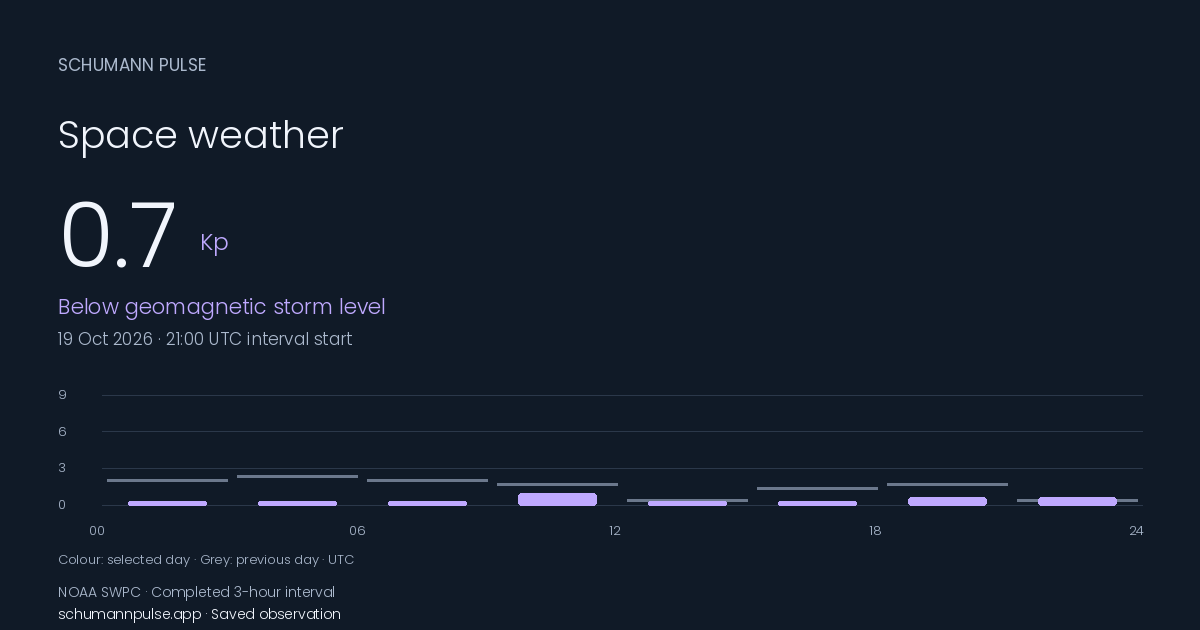
Below geomagnetic storm level
19 Oct 2026 · interval start
The latest interval shown is below NOAA’s geomagnetic storm threshold. This does not predict the next interval or local aurora visibility.
Captured 21 Oct 2026, 12:49 UTC. This shared view stays as captured; later source revisions may differ.
Completed three-hour intervals 19 Oct 2026
Observed maximum
1.0KpCompared with previous day
-1.0 Kp8 matched three-hour intervals · mean differenceThe storm threshold
5.0Kp · Minor / G1Estimated index · NOAA SWPC ↗
Source estimates can be revised.
The planetary Kp index estimates disturbances in Earth’s magnetic field. Each bar represents a three-hour interval.
Read the chart guide ↗View observations as a table
| Time | Kp | Previous day, same time |
|---|---|---|
| 00:00 | 0.33 | 2 |
| 03:00 | 0.33 | 2.33 |
| 06:00 | 0.33 | 2 |
| 09:00 | 1 | 1.67 |
| 12:00 | 0.33 | 0.33 |
| 15:00 | 0.33 | 1.33 |
| 18:00 | 0.67 | 1.67 |
| 21:00 | 0.67 | 0.33 |
Send a little perspective.
Share this dated completed-interval chart. The chart and numbers stay with the link, even after today moves on.
 Schumann Pulse for iPhone
A little context.
With you through the day.
Keep observations close, choose activity alerts and build a journal of your own day. Explore comparisons as your history grows.
Go beyond the number.
What the Kp index tells you ↗
The scale, the three-hour window and why a planetary index is not your local sky.
02 / The meaningGeomagnetic storms, explained ↗
From a minor G1 storm to extreme G5: the different levels and their effects.
03 / The SunSolar flares and X-ray classes ↗
Why a flare, a coronal mass ejection and a geomagnetic storm are different events.
What you are looking at.
NOAA SWPC estimates planetary Kp using ground-based magnetometer observations. Each bar covers a three-hour UTC interval and can be revised. The running estimate is shown separately with its own update time. The chart, day comparison and saved cards use completed three-hour intervals, labelled by their start time. Neither series predicts the next interval.
We check for updates every five minutes. The comparison uses only intervals present on both days, so a partial day is not compared with an entire day. Gaps remain gaps. Solar X-ray flux is shown separately with its own timestamp.
These are environmental observations. They cannot establish why you feel a certain way or whether aurora will be visible at your location.
How the Kp index works ↗ · Geomagnetic storm levels explained ↗ · Our source standards