
The field guide · People & discoveries
The May 2024 solar storm: what happened, step by step?
On 10 May 2024, a sequence of solar eruptions drove an extreme G5 geomagnetic storm at Earth. The event produced unusually widespread auroras. Solar flares, arriving coronal mass ejections and the resulting geomagnetic disturbance were different stages, with different timestamps.
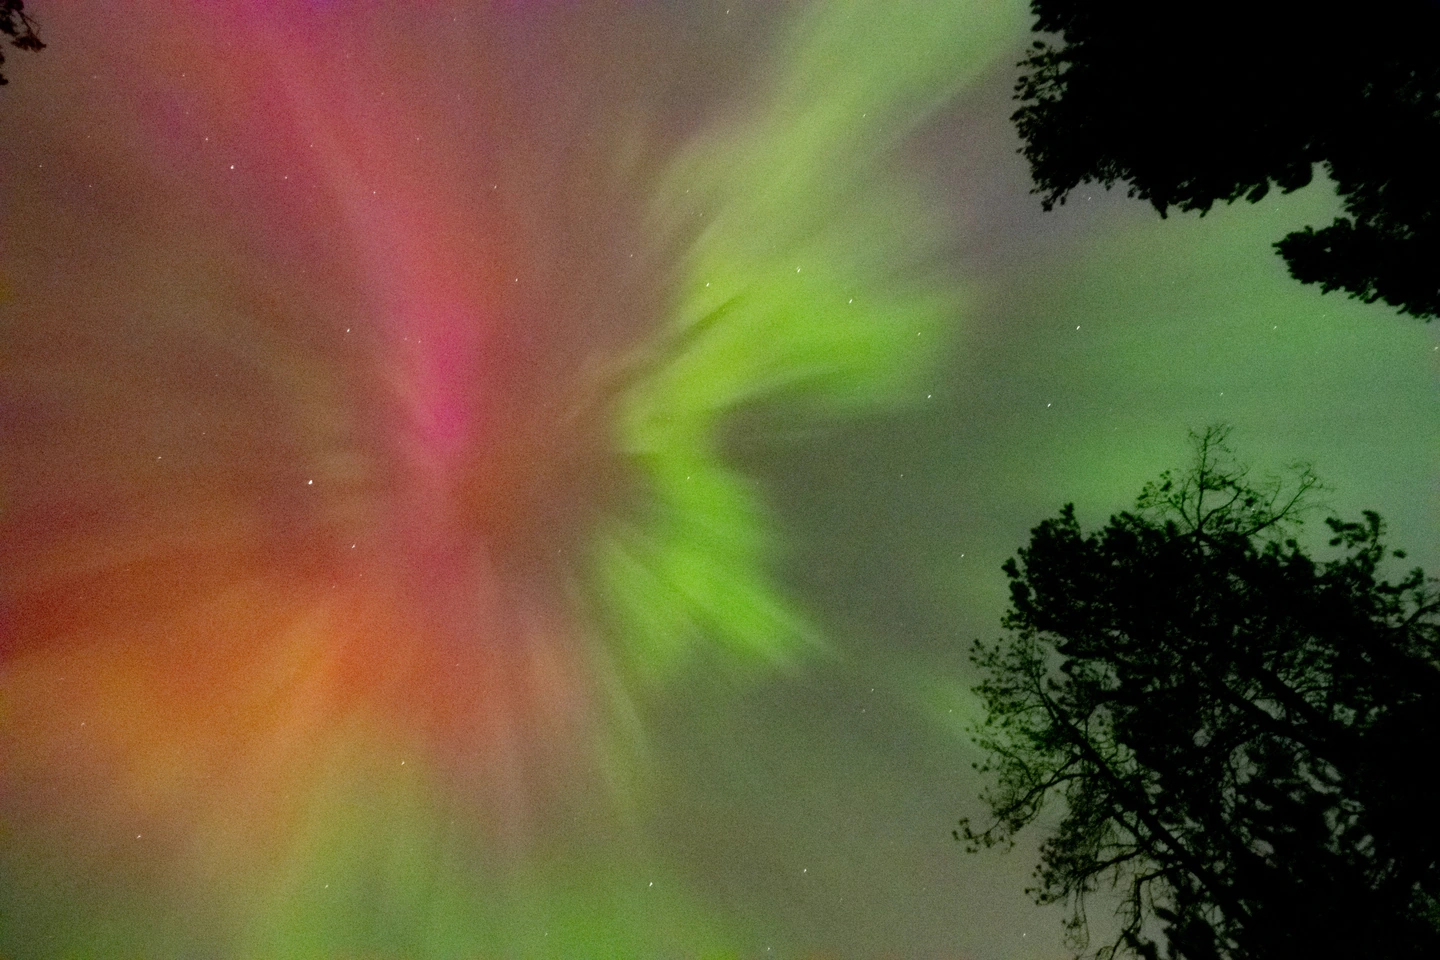 Open figure at full size ↗
First, distinguish the three events
A solar flare is a burst of electromagnetic radiation. A coronal mass ejection, or CME, is an outward eruption of plasma and magnetic field. A geomagnetic storm describes the disturbance of Earth’s magnetic environment. One spectacular solar image does not timestamp all three. NOAA: coronal mass ejections [6].
During 7–11 May, NASA reported multiple strong flares and at least seven Earth-directed CMEs. The series, rather than a single photograph of a flare, is the useful starting point for this storm’s story. NASA’s event account [1].
10 May: from reported arrival to extreme conditions
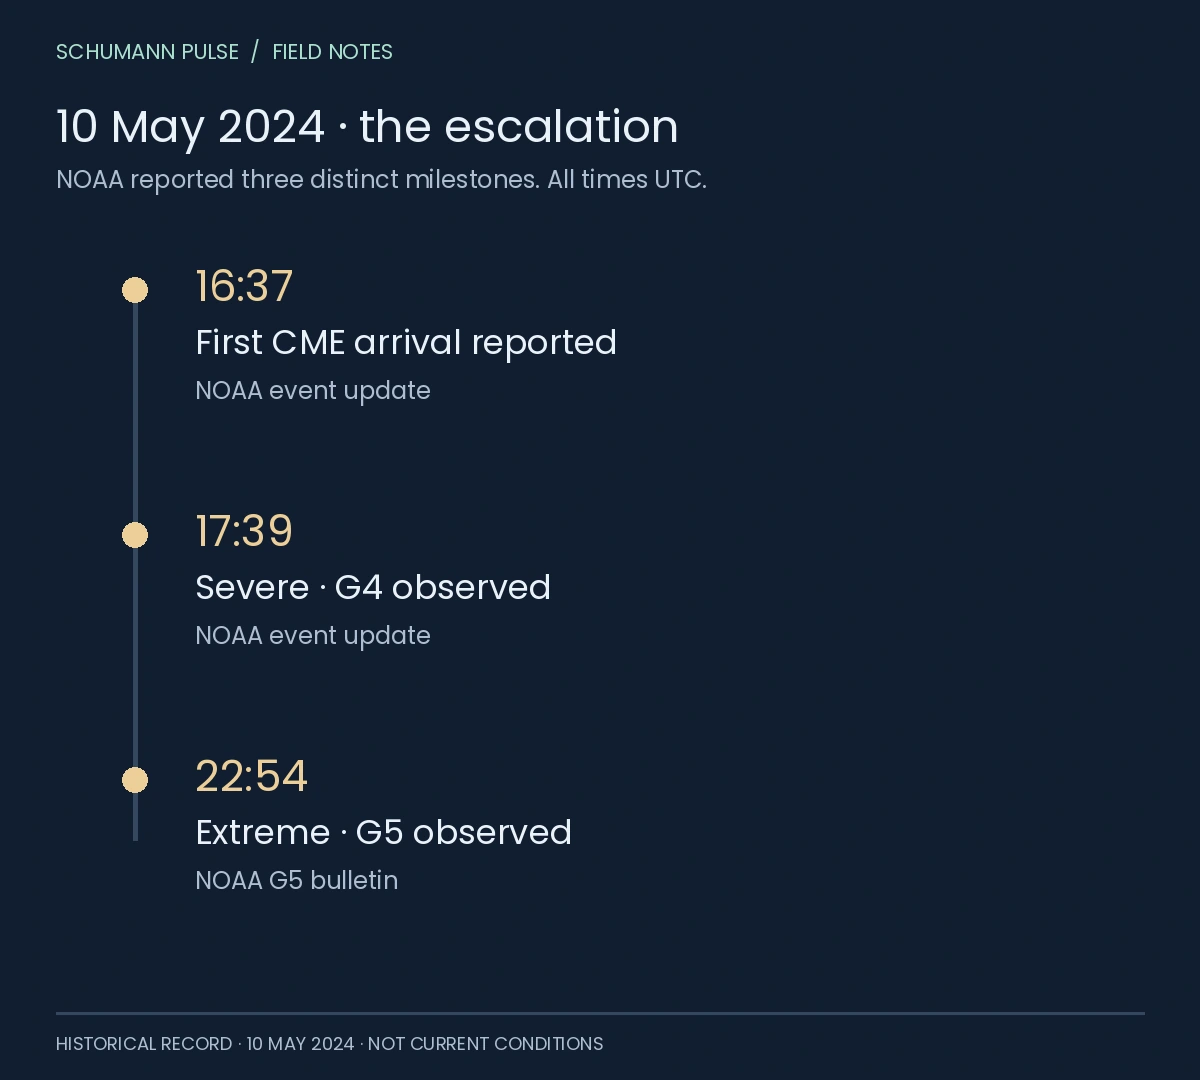
Schumann Pulse · field notes
10 May 2024: the escalation.
Three distinct milestones reported by NOAA.
16:37 UTC
First CME arrival reported
NOAA event update
17:39 UTC
Severe · G4 observed
NOAA event update
22:54 UTC
Extreme · G5 observed
NOAA G5 bulletin
Historical record, not current conditions. Arrival and storm classifications are separate events. Times are converted from EDT to UTC.
NOAA reports the first CME arrival.
The agency’s event update gives 12:37 p.m. EDT. This is the reported arrival marker, not the time the G5 classification began.
Severe G4 conditions are observed.
The same update gives 1:39 p.m. EDT, after G3 at 1:08 p.m. EDT.
Extreme G5 conditions are first observed.
NOAA’s G5 bulletin states 6:54 p.m. EDT. The bulletin itself was published at 23:58 UTC; publication time and observation time differ.
Sources: NOAA’s 10 May event update [2] and the G5 observation bulletin [3]. EDT was UTC−4 on this date; we add four hours for this timeline. “Arrival” can depend on the instrument or boundary being discussed, so these times are explicitly attributed rather than presented as identical in every dataset.
What does G5 mean here?
G5 is NOAA’s extreme geomagnetic storm category. It describes a space-weather condition, not the brightness of every aurora and not a medical risk score. NOAA’s scale connects geomagnetic levels with possible effects on systems such as power networks, satellites and navigation. NOAA space-weather scales [4].
The label also does not mean every minute of the multi-day event was equally intense. Our G1–G5 guide explains the categories and why a peak and a current reading answer different questions.
What the photograph shows—and does not show
The image above records a coronal aurora over southwestern British Columbia on 10 May 2024, credited to NASA / Mara Johnson-Groh. Its date and location make it evidence of this event, unlike a generic stock aurora. NASA image record [5].
It does not establish the view from another country, the brightness to an unaided eye or the precise moment of G5 onset. Those questions need separate observations. Our aurora visibility guide explains why even a very strong event can be missed locally.
Why the May 14 flare is not the beginning of this storm
Images of a later X8.7 flare on 14 May also appear in NASA’s account of the active region. That flare came after the 10 May onset. Reusing it without its date can reverse the sequence and make a dramatic image explain the wrong event. NASA’s dated chronology [1].
What to take into the next storm
When you encounter a viral screenshot, ask: which phenomenon, which source, and which time? Keep a forecast separate from an observation and a historical peak separate from conditions now. Those three checks are useful even when the headline is accurate.
This article is a historical explainer. For current, timestamped readings, open space weather today.
Sources
References in the text lead here. Original publications open in a new tab; this guide stays open.
- [1] NASA: how the May 2024 storm was tracked (opens in a new tab) First mention ↑.
- [2] NOAA: reported CME arrival and G3/G4 observations, 10 May 2024 (opens in a new tab) Back to text ↑.
- [3] NOAA: first G5 observation and bulletin publication time (opens in a new tab) Back to text ↑.
- [4] NOAA: space-weather scale definitions (opens in a new tab) Back to text ↑.
- [5] NASA / Mara Johnson-Groh: the 10 May aurora photograph (opens in a new tab) Back to text ↑.
- [6] NOAA: coronal mass ejections (opens in a new tab) Back to text ↑.
Your next observation
Give your observations room to grow.
Keep your sleep rating, feelings, energy and everyday context in a personal journal. Revisit your records and explore suitable comparisons over time, including when no clear difference appears.
iPhone app coming soon · history and personal comparisons live in the app.