
The Schumann resonance guide
Your guide to
Schumann resonance.
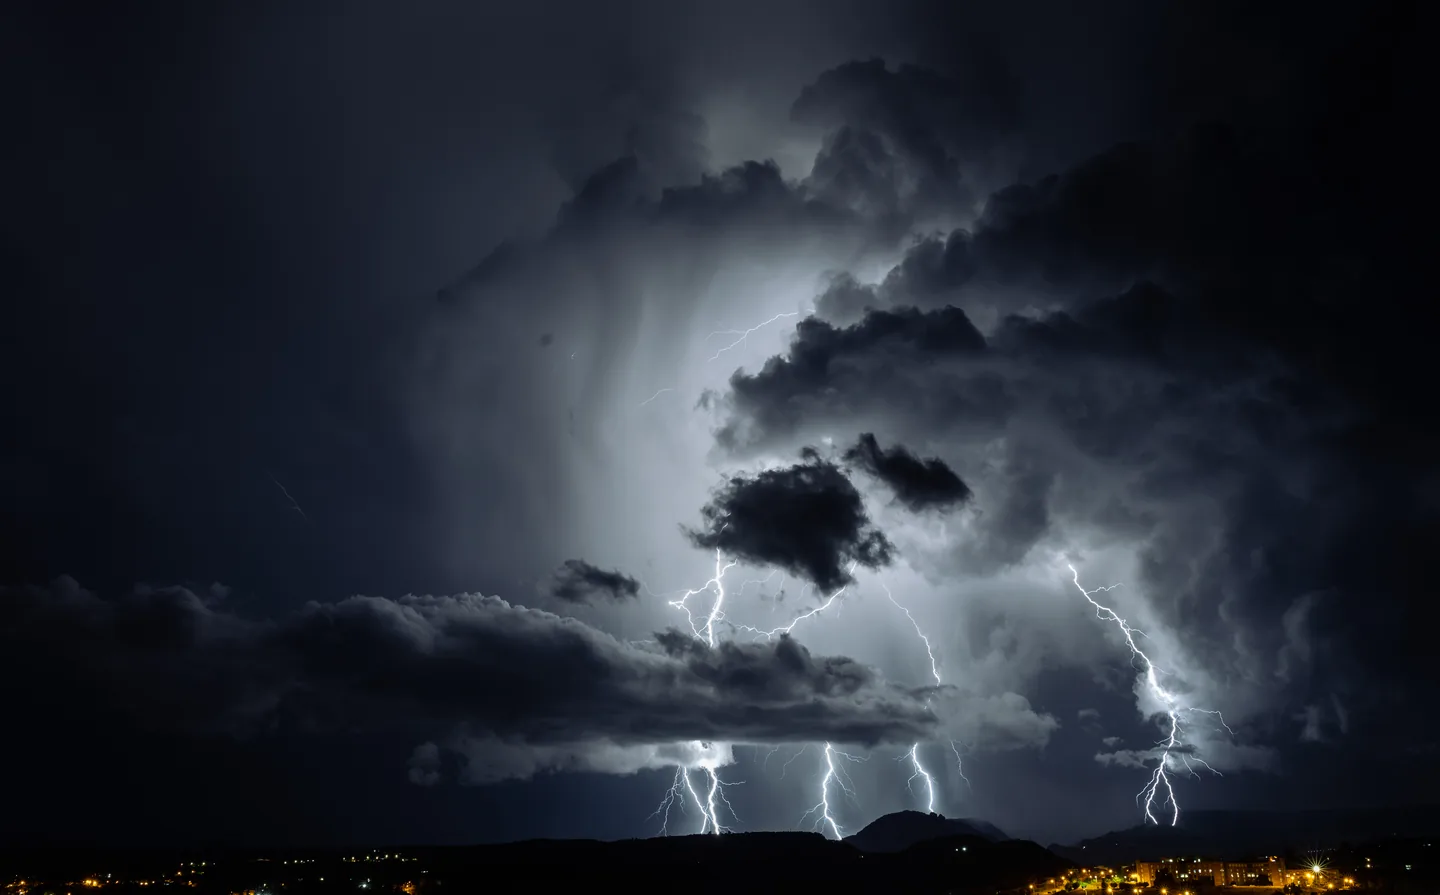
Lightning sets Earth’s natural electromagnetic resonances in motion. Explore the science, learn to read a station chart, or follow the people who first measured the signal.
See current station readingsTomsk numbers · Etna spectrogram · station context
A little context first
A bright chart.
Three questions.
Start with what was measured. A stronger signal, a shifted frequency peak and a different colour scale describe different things. The station and timestamp give each observation its context.
- Frequency
- Where a resonance peak sits on the frequency axis, measured in hertz. The familiar 7.83 Hz is an approximate reference, not a live reading for every station.
- Amplitude
- How strong the recorded signal is in the instrument’s stated units. A larger amplitude does not mean the frequency has risen by the same amount.
- Station & time
- The sensor, measured component, processing and time window matter. Compare those details before treating two plots as the same measurement.
Background: NASA’s resonance explanation (opens in a new tab) and Nagycenk’s instrument history (opens in a new tab). The articles below explain the details and link their original sources.
01 / Read the signal
Begin with the question behind the chart.
Get the basic idea, then separate frequency, amplitude and the meaning of a bright band.
- What is Schumann resonance?
Start with lightning and the space between Earth and the ionosphere.
- What does 7.83 Hz actually mean?
Understand the fundamental mode and the higher resonance peaks.
- How do I read a Schumann chart?
Identify axes, colour scales, broad features and missing data.
- What do whiteouts and blackouts mean?
Separate colour limits, valid low readings and missing samples.
- What does the quality factor tell me?
Compare peak widths and understand why Q differs from signal strength.
- Is a Schumann spike a magnetic storm?
Separate two different measurements of Earth’s environment.
02 / Meet the instruments
A global phenomenon.
A local measurement.
Follow the signal through sensors and processing, then explore the observatories behind the plots.
- How is the signal measured?
Meet electric antennas, magnetic coils and the work of calibration.
- Where are the research stations?
Explore a sourced map of documented ELF research locations.
- Why do stations show different readings?
Compare lightning geometry, sensor components and display choices.
- What is measured at Nagycenk?
Visit the history and instruments of the Hungarian observatory.
- What does Etna’s receiver record?
Understand the EC200 coil and the available source spectrogram.
03 / Follow the discoveries
From a prediction
to a measured world.
Trace the experiments and ideas that made this faint electromagnetic environment observable.
- Who was Winfried Otto Schumann?
Meet the physicist behind the 1952 resonance prediction.
- How were the resonances first confirmed?
Separate the prediction, early observations and a resolved spectrum.
- How did Hertz demonstrate radio waves?
Explore an earlier laboratory experiment and what it established.
- How did Wilson connect storms and fair weather?
Discover a related atmospheric-electricity idea: the global circuit.
- Why do LIGO researchers care about Schumann resonance?
See why correlated magnetic noise matters to a different experiment.
- Can a satellite detect these resonances?
Follow the evidence for signals measured above the ionosphere.
 Open figure at full size ↗
Look behind a plot
The instrument is
part of the story.
- Identify the station and the electric or magnetic component.
- Read the units, time zone and measurement timestamp.
- Check the legend and any gaps before interpreting a peak.
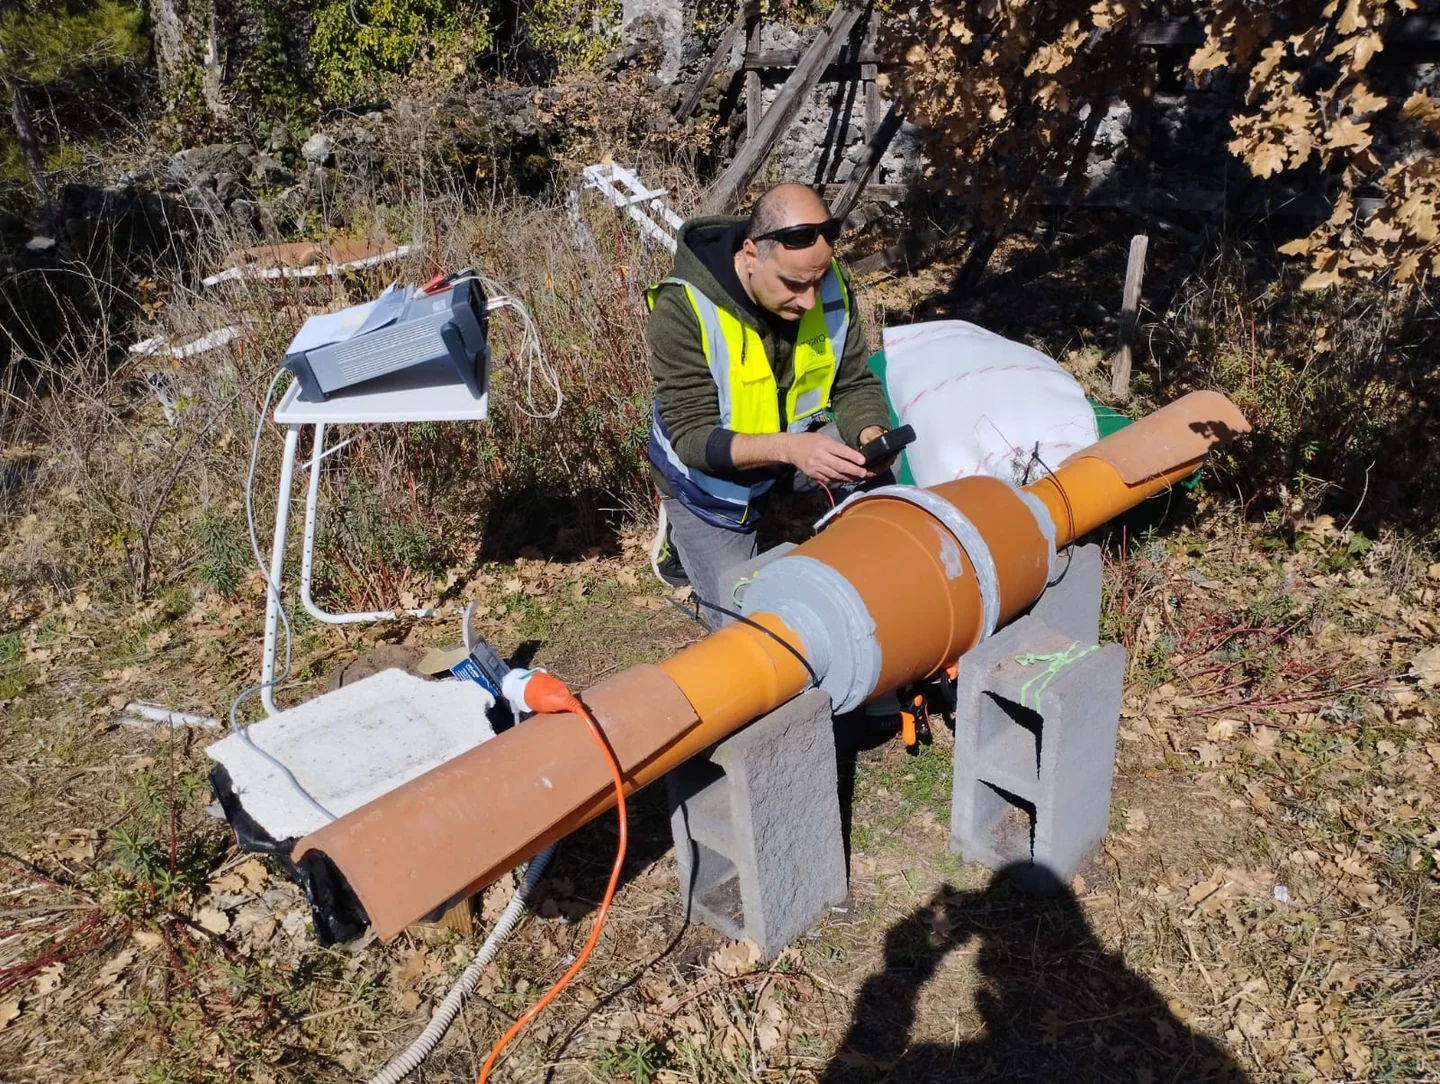
This documented Etna receiver measures a magnetic signal. A photograph explains the equipment; it does not report current activity.
Explore the measurement processA different kind of question
Wondering about your own experience?
Keep the physical measurement and a personal interpretation separate. These guides look at research limits and careful ways to keep a journal.
- Schumann resonance and health
Distinguish natural measurements, artificial fields and audio claims.
- Track your experience with context
Record ordinary days as well as unusual ones, without assuming a cause.
Your next observation
Put a reading beside your own experience.
Record how you feel, with optional energy, mood and focus ratings. Revisit your entries alongside dated station readings and explore comparisons when enough suitable records are available.
iPhone app coming soon · history and personal comparisons live in the app.