
The field guide · Earth
What is the Schumann resonance quality factor?
The quality factor, Q, describes how narrow a resonance is relative to its centre frequency. For an individual fitted Lorentzian power peak, Q is the centre frequency divided by its full width at half power. A higher Q means a narrower relative peak—not a stronger signal or a better day for your health.
Schumann Pulse · reading the signal
Same centre. Different width.
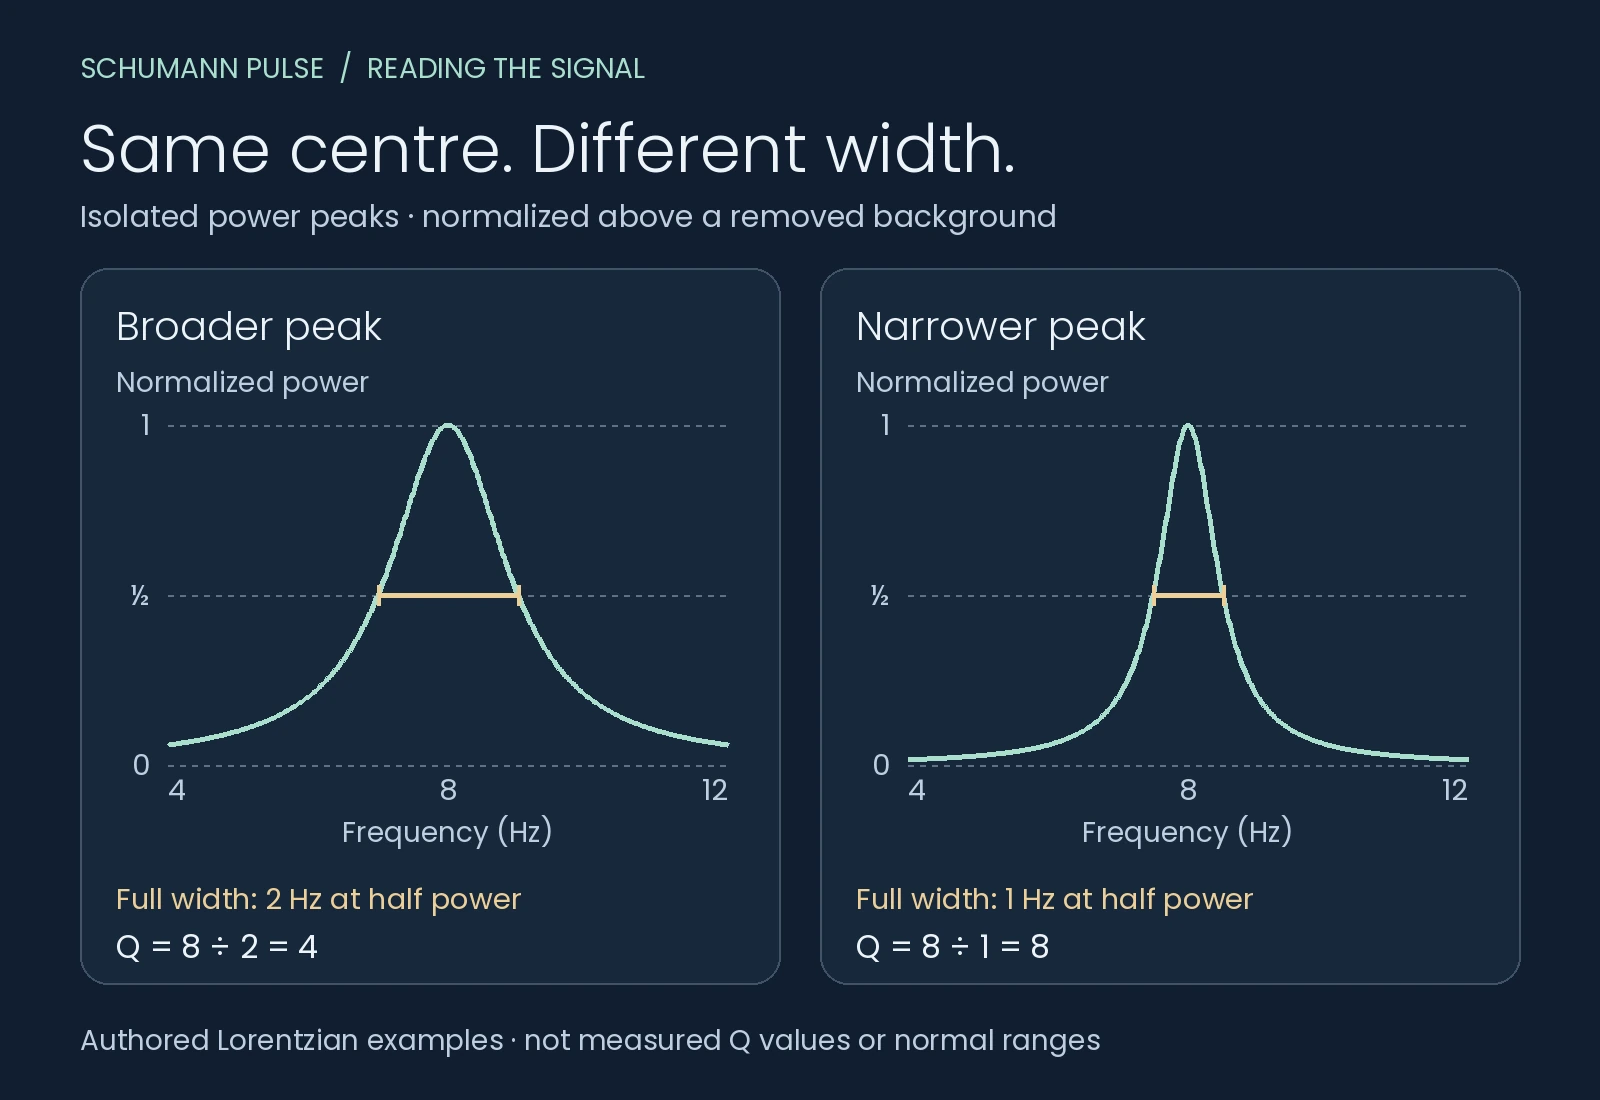
Two isolated power peaks, each normalized to 1 above a removed background. Read the full width at half power.
Broader peak
Normalized power ↑
Frequency (Hz) →
Gold line: 7–9 Hz at half power.
- Centre
- 8 Hz
- Full width
- 2 Hz
- Q = 8 ÷ 2
- 4
Narrower peak
Normalized power ↑
Frequency (Hz) →
Gold line: 7.5–8.5 Hz at half power.
- Centre
- 8 Hz
- Full width
- 1 Hz
- Q = 8 ÷ 1
- 8
Authored Lorentzian examples, not measured Schumann Q values. Normalizing both peaks to 1 does not compare their observed strengths.
What does Q describe?
Schumann resonances are broad peaks in the spectrum of the Earth–ionosphere cavity. Their centre frequency, strength and width are different properties. Q relates the first and third: it describes spectral sharpness relative to the peak’s location.
In a resonance model, Q is also connected with energy loss: lower losses allow oscillations to persist longer and produce a sharper resonance. Extracting Q from an actual Schumann recording requires fitting and interpretation, because the broad modes overlap. Williams, Mushtak and Nickolaenko studied how Lorentzian fits recover parameters from Earth–ionosphere resonance spectra. Their 2006 study [1].
How is the quality factor calculated?
For the fitted power-peak convention used here:
Q = centre frequency ÷ full width at half power
The width is often written Δf, so the compact form is Q = f₀ / Δf. Both frequencies use hertz; their units cancel, leaving Q without a unit.
“Half power” means half of the individual peak’s power above its background. Locate one crossing on each side of the peak and take the full distance between them. Do not use half the total curve height when a background is included, or substitute half amplitude for half power. The study’s spectral-fitting discussion explains the peak-width definition and its limitations. Williams and colleagues, section 6 [1].
Two examples you can read without a calculator
The original figure above uses two isolated mathematical peaks centred at 8 Hz. Each is normalized to a peak power of 1 after removing the background; the half-power level is 0.5.
- Broader example: half-power crossings at 7 and 9 Hz. The full width is 2 Hz, giving Q = 8 ÷ 2 = 4.
- Narrower example: crossings at 7.5 and 8.5 Hz. The width is 1 Hz, giving Q = 8 ÷ 1 = 8.
The narrower peak has twice the Q at the same centre frequency. These are authored teaching curves, not station measurements, normal ranges or a current Q reading. Making both peaks the same height helps you compare width; it does not imply that two real signals have equal strength.
Is Q the same as amplitude or frequency?
No. Think of three separate questions:
- Frequency: where is the peak on the horizontal axis?
- Amplitude or power: how large is the measured response, in the stated convention and units?
- Q: how narrow is the fitted peak relative to its centre?
A stronger-looking peak does not, by itself, answer the width question. A whiter spectrogram cannot answer it either: colours may have reached a display limit. Read whiteouts and blackouts before inferring a physical change from brightness.
Why can different reports give different Q values?
The measurement and processing method matter. A 2018 Sierra Nevada study compared processing options and found meaningful differences in extracted resonance parameters. Its authors called for standardized methods, or enough station and processing detail to make comparisons interpretable. Rodríguez-Camacho and colleagues [2].
A later Mikhnevo study explicitly examined quality factors derived from amplitude and power spectra. Its results underline why those conventions cannot be casually mixed. The simple power-width example on this page is not a recipe for reading every observatory’s Q product. Goncharov and colleagues, 2022 [3].
Before comparing numbers, look for the mode, measured field component, averaging interval, noise treatment, background model and fitting convention. A cropped image usually does not provide these. Our measurement guide follows the recording from sensor to processed result.
Does a higher Q mean better data or better wellbeing?
“Quality” is a technical name here, not a rating of the observatory, a health score or a verdict on how you should feel. Keep measurement quality, resonance Q and your own experience separate.
For the wider picture, follow the Schumann resonance reading route. For available current measurements, use today’s station page; this article does not introduce a live Q feed.
Try a chart yourself
Explore our interactive chart lab: change power, centre frequency, peak width or colour scale while a fixed reference stays visible. All examples are authored teaching models.
Sources
References in the text lead here. Original publications open in a new tab; this guide stays open.
- [1] Williams, Mushtak and Nickolaenko (2006): distinguishing ionospheric models using Schumann resonance spectra (opens in a new tab) First mention ↑.
- [2] Rodríguez-Camacho and colleagues (2018): the need for a unified processing methodology (opens in a new tab) Back to text ↑.
- [3] Goncharov and colleagues (2022): long-term Schumann dynamics at Mikhnevo (opens in a new tab) Back to text ↑.
Your next observation
Put a reading beside your own experience.
Record how you feel, with optional energy, mood and focus ratings. Revisit your entries alongside dated station readings and explore comparisons when enough suitable records are available.
iPhone app coming soon · history and personal comparisons live in the app.