
The field guide · Earth
Can you hear Schumann resonance?
Schumann resonance is an electromagnetic phenomenon, not a sound wave travelling through the air. A recording called “7.83 Hz” must be interpreted by how it was made: measured data can be translated into sound, while music or modulated tones may simply use that number as a design choice.
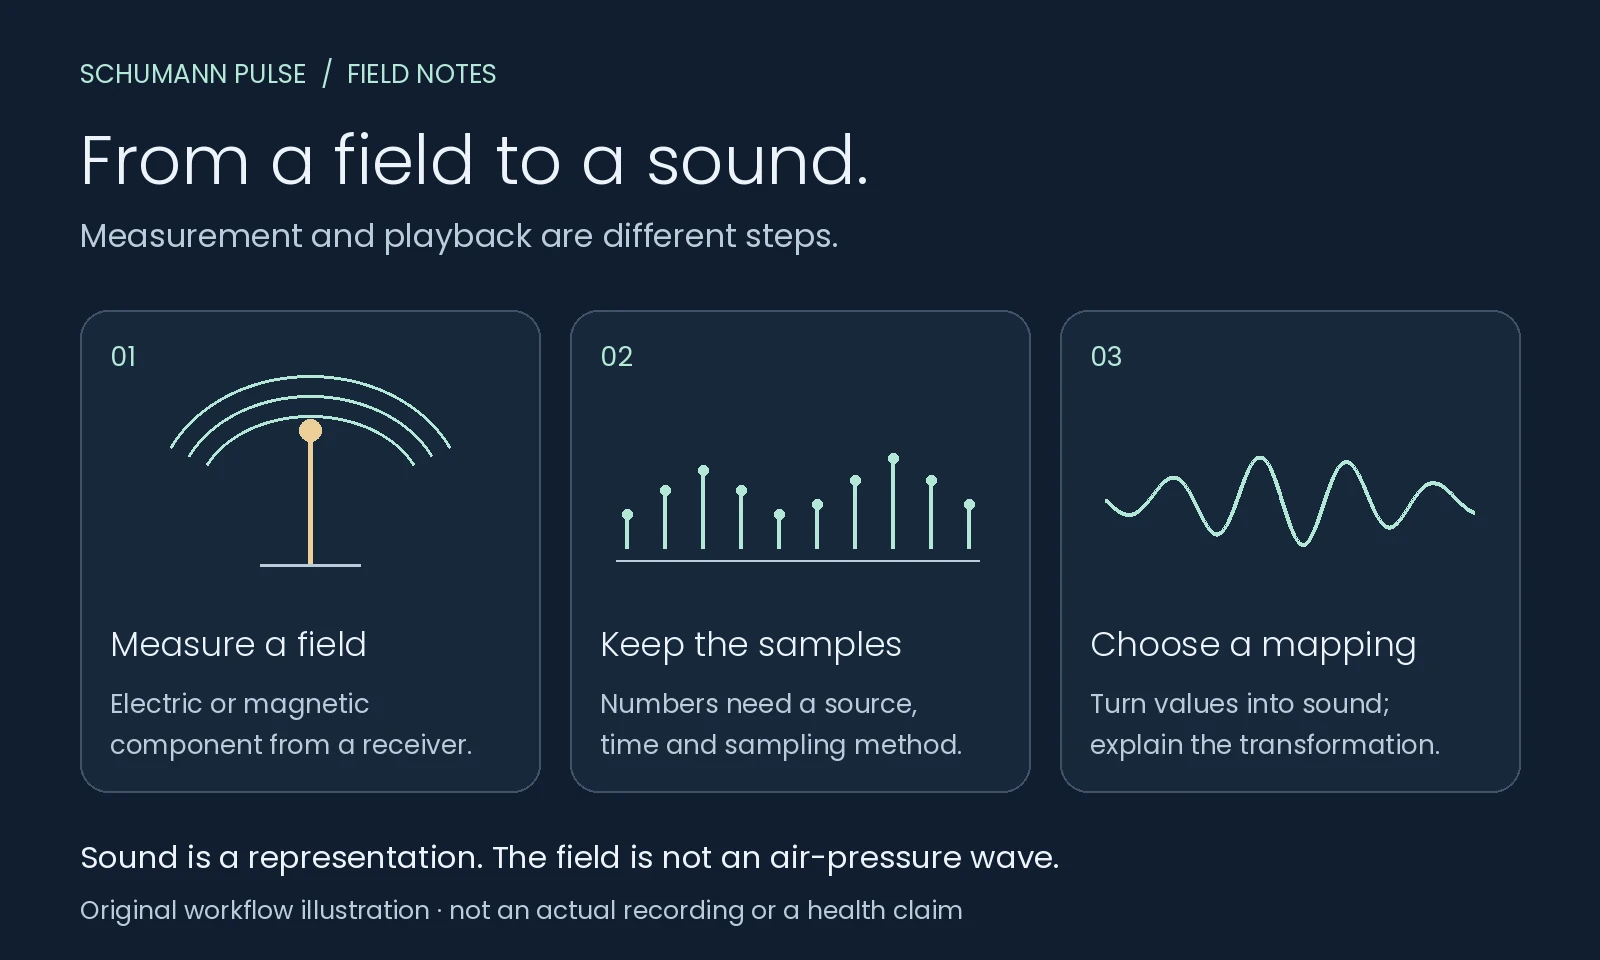
Schumann Pulse · field notes
From a field to a sound.
Three distinct steps. One method to explain.
Measure a field
An ELF receiver measures an electric or magnetic component.
Keep numerical samples
The recording needs a source, time and sampling method.
Choose a sound mapping
Translate values to audible features, or change the playback rate.
Sound is the chosen representation. The measured field is not an air-pressure wave.
Original workflow illustration, not an actual recording or a claim about health effects.
An electromagnetic field is not an air vibration
The familiar sound of a bell reaches you through pressure waves. Those vibrations move the eardrum and are passed through the middle ear to the cochlea, where sensory cells help turn mechanical movement into nerve signals. NIDCD’s explanation of hearing [1].
Schumann resonances instead involve electromagnetic fields excited by lightning in the region between Earth and the ionosphere. An ELF receiver measures an electric or magnetic component; it is not simply a microphone listening to a very low note. NASA describes this electromagnetic mechanism in its Schumann resonance explanation [2].
That distinction comes first. Giving two phenomena frequencies measured in hertz does not make them the same physical thing. Hertz means cycles per second; it does not tell you whether the cycles describe air pressure, a changing field or a digital playback setting.
Is 7.83 Hz within the normal hearing range?
The conventional human hearing range is approximately 20 Hz to 20,000 Hz, with substantial variation between people and listening conditions. An acoustic frequency of 7.83 Hz is below that usual range. OpenStax, hearing [3].
This does not turn Schumann resonance into an inaudible acoustic wave: the field-versus-pressure distinction still applies. Nor is 7.83 Hz an exact, permanent value for every station’s first resonance peak. See Schumann frequencies for the broader modes and their changing measured centres.
How can scientific data become sound?
Sonification maps information to sound. A designer might map a measured value to pitch, volume or another audible feature. Audification can treat a time series more directly as a waveform, often playing samples at a different rate to bring variations into an audible range. NASA’s CDAWeb documentation describes these approaches for space-physics data. NASA audification guide [4].
The original diagram above separates three stages: measurement, numerical samples and a chosen sound mapping. This is a workflow, not an actual station recording. The mapping must be documented before the listener can interpret what a louder or higher note means.
A simple mathematical example: playing a sampled oscillation 100 times faster would shift an original 7.83 cycles per second to 783 cycles per second in the playback, while compressing its duration by the same factor. That is a calculated illustration, not a claim that a particular track uses this method.
What might a “7.83 Hz” audio track contain?
The title alone is not enough. Ask which of these is being offered:
- Data-derived sound: a named measurement series has been transformed into audio. Look for the station, date, measured component and mapping.
- A modulated audible tone: an audible carrier changes at a slower rate. Hearing the carrier is different from directly hearing the modulation rate as a tone.
- Composed music or ambience: a producer uses the frequency as a theme or production setting. That does not establish that the sound comes from an observatory.
These are interpretation categories, not assessments of any specific track. A video thumbnail, a waveform animation or the words “Earth frequency” do not identify the underlying recording method.
What should a trustworthy sound example disclose?
Look for an original source, instrument or data product, recording time, sampling interval and any processing. For a transformation, ask what each audible feature represents and how playback speed changed. Missing samples should not quietly become unexplained silence.
It is fine to enjoy a piece of music as music. Its title or frequency label does not establish a health benefit, and this guide makes no claim that listening reproduces an environmental exposure. For the wider evidence, read Schumann resonance and health.
To explore the measurements visually first, try our chart lab, where power, frequency, width and colour each have a stated meaning.
Sources
References in the text lead here. Original publications open in a new tab; this guide stays open.
- [1] NIDCD: how hearing works (opens in a new tab) Back to text ↑.
- [2] NASA Scientific Visualization Studio: Schumann resonance (opens in a new tab) Back to text ↑.
- [3] OpenStax College Physics, section 17.6: hearing (opens in a new tab) Back to text ↑.
- [4] NASA Space Physics Data Facility: audification and sonification (opens in a new tab) Back to text ↑.
Your next observation
Put a reading beside your own experience.
Record how you feel, with optional energy, mood and focus ratings. Revisit your entries alongside dated station readings and explore comparisons when enough suitable records are available.
iPhone app coming soon · history and personal comparisons live in the app.