
The field guide · Earth
What does a Schumann resonance spike mean?
A Schumann resonance “spike” usually means a sudden rise in a plotted quantity. It does not automatically mean the resonance frequency increased. First identify what the chart measures, at which station and over what interval; a bright patch or tall point alone cannot establish its cause.
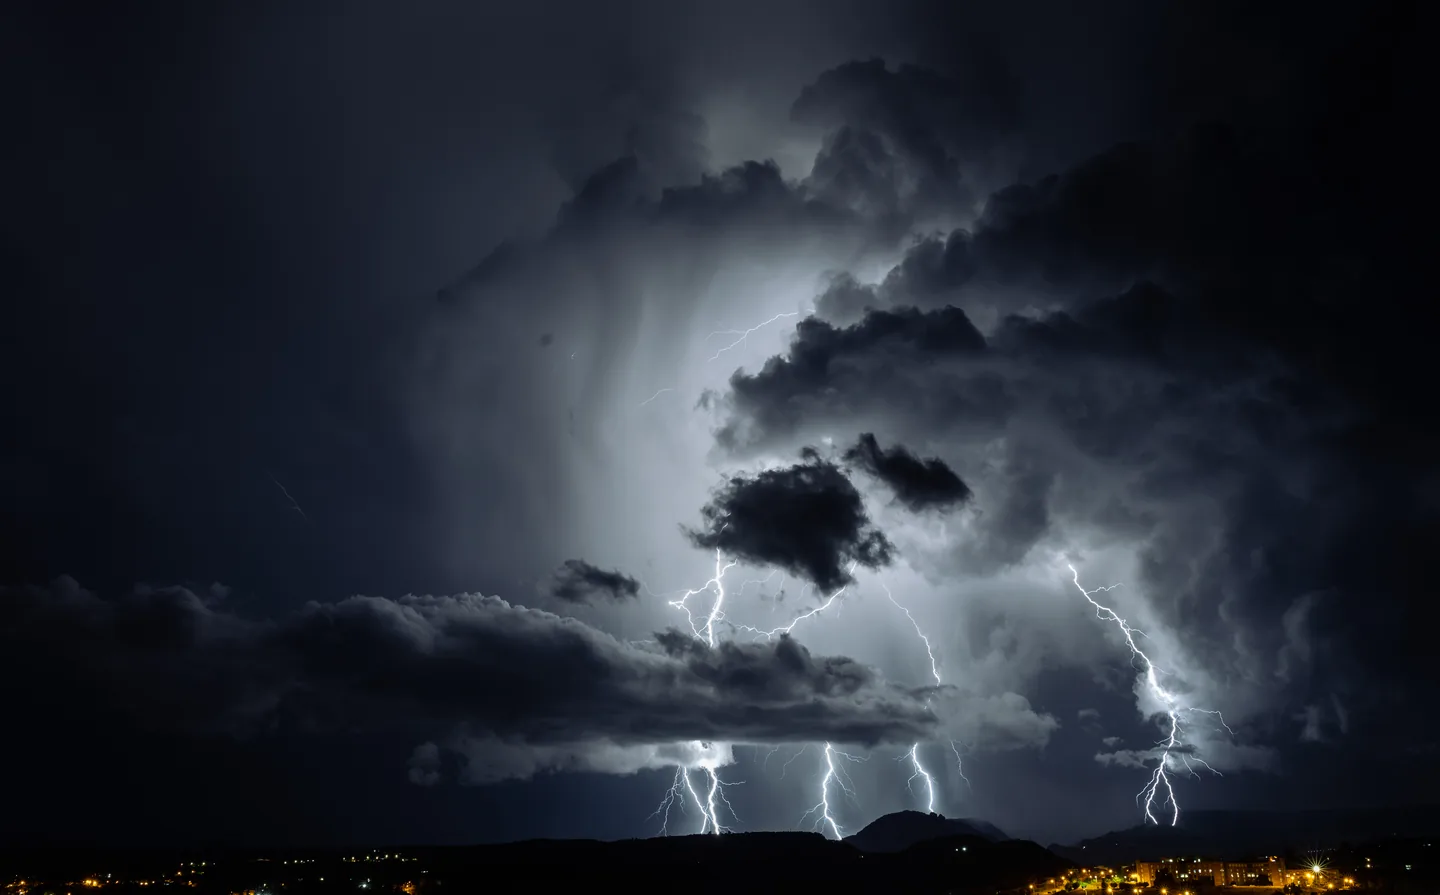
A spike in what, exactly?
The word spike is useful shorthand, but it leaves out the measurement. A line might show amplitude, power, a fitted frequency or a derived index. On a spectrogram, colour represents a quantity across frequency and time. These displays answer different questions.
For example, a peak can become taller while remaining centred at 8 Hz. A value of “40” on a strength scale is not a frequency of 40 Hz. Our interactive chart lab lets you change the power of an authored peak without moving its centre. It is a teaching example, not a recording.
What can produce a sudden bright feature?
Lightning excites natural electromagnetic resonances in the Earth–ionosphere cavity. But a receiver also records its surroundings. The British Geological Survey describes broad-band features from nearby lightning and short system errors in its induction-coil plots, alongside interference from the electricity supply. Its examples show why a visible feature needs instrument context. BGS measurement explanation [1].
That is a list of possibilities, not a diagnosis of the chart you are looking at. Check the station’s own notes before attributing an event to distant lightning, local interference or a technical problem. Compare axes too: stations do not all put time and frequency in the same direction.
The display adds another layer. Two images with different colour limits can make identical values look quite different. See whiteouts and blackouts for an original comparison of colour saturation, low values and missing samples.
Is every spike a Q-burst?
No. Q-burst is a specific research term for an electromagnetic transient associated with a powerful lightning discharge in the Earth–ionosphere cavity. It is not a label for every unusually tall point on an online graph. American Meteorological Society glossary [2].
A 2008 study describes isolated ELF pulses with durations around 0.3–1.5 seconds and analyses their waveforms. That is a different level of detail from a minute-averaged amplitude series or a screenshot. Identifying such a transient requires suitable measurements and analysis; the article does not provide a universal visual threshold for a “Schumann spike.” Nickolaenko and colleagues [3].
Five checks before sharing a spike
- Read the quantity and unit. Is the value amplitude, power, frequency or an index? Keep that name with the number.
- Find the measurement time. Include the date, time zone and averaging interval when available. The time a screenshot was posted may be different.
- Name the station. A local measurement is not automatically a global maximum. Different receivers and processing methods are not interchangeable.
- Keep the scale visible. Cropping away a legend can remove the information needed to interpret the event.
- Look for a source explanation. If the cause is not documented, describe the observation without inventing one.
A careful caption might say: “The station’s amplitude series rose during this interval; the cause is not identified here.” It gives the reader something verifiable without turning uncertainty into a dramatic claim.
Does a higher spike mean a stronger geomagnetic storm?
These are different measurements. Schumann resonances concern extremely low-frequency fields in the Earth–ionosphere cavity. Geomagnetic storm indices describe disturbance of Earth’s magnetic environment. They are not two interchangeable scales of one event. Our Schumann versus geomagnetic storms guide explains the distinction.
Nor does a tall plotted value establish how a particular person should feel. Keep a journal entry as a record of your experience, not proof of the spike’s effect. For a measured environmental starting point, open current station readings and check the source timestamp.
Sources
References in the text lead here. Original publications open in a new tab; this guide stays open.
- [1] British Geological Survey: induction-coil measurements and interpreting their plots (opens in a new tab) Back to text ↑.
- [2] American Meteorological Society: Q-burst definition (opens in a new tab) Back to text ↑.
- [3] Nickolaenko and colleagues (2008): waveform analysis of Schumann resonance Q-bursts (opens in a new tab) Back to text ↑.
Your next observation
Put a reading beside your own experience.
Record how you feel, with optional energy, mood and focus ratings. Revisit your entries alongside dated station readings and explore comparisons when enough suitable records are available.
iPhone app coming soon · history and personal comparisons live in the app.