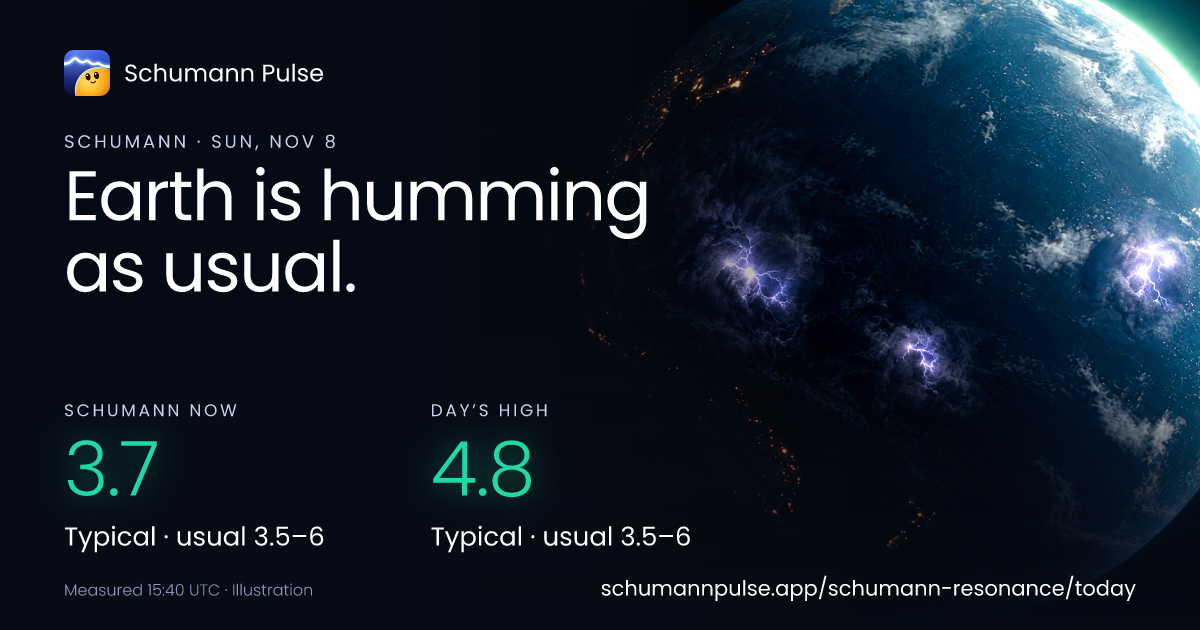
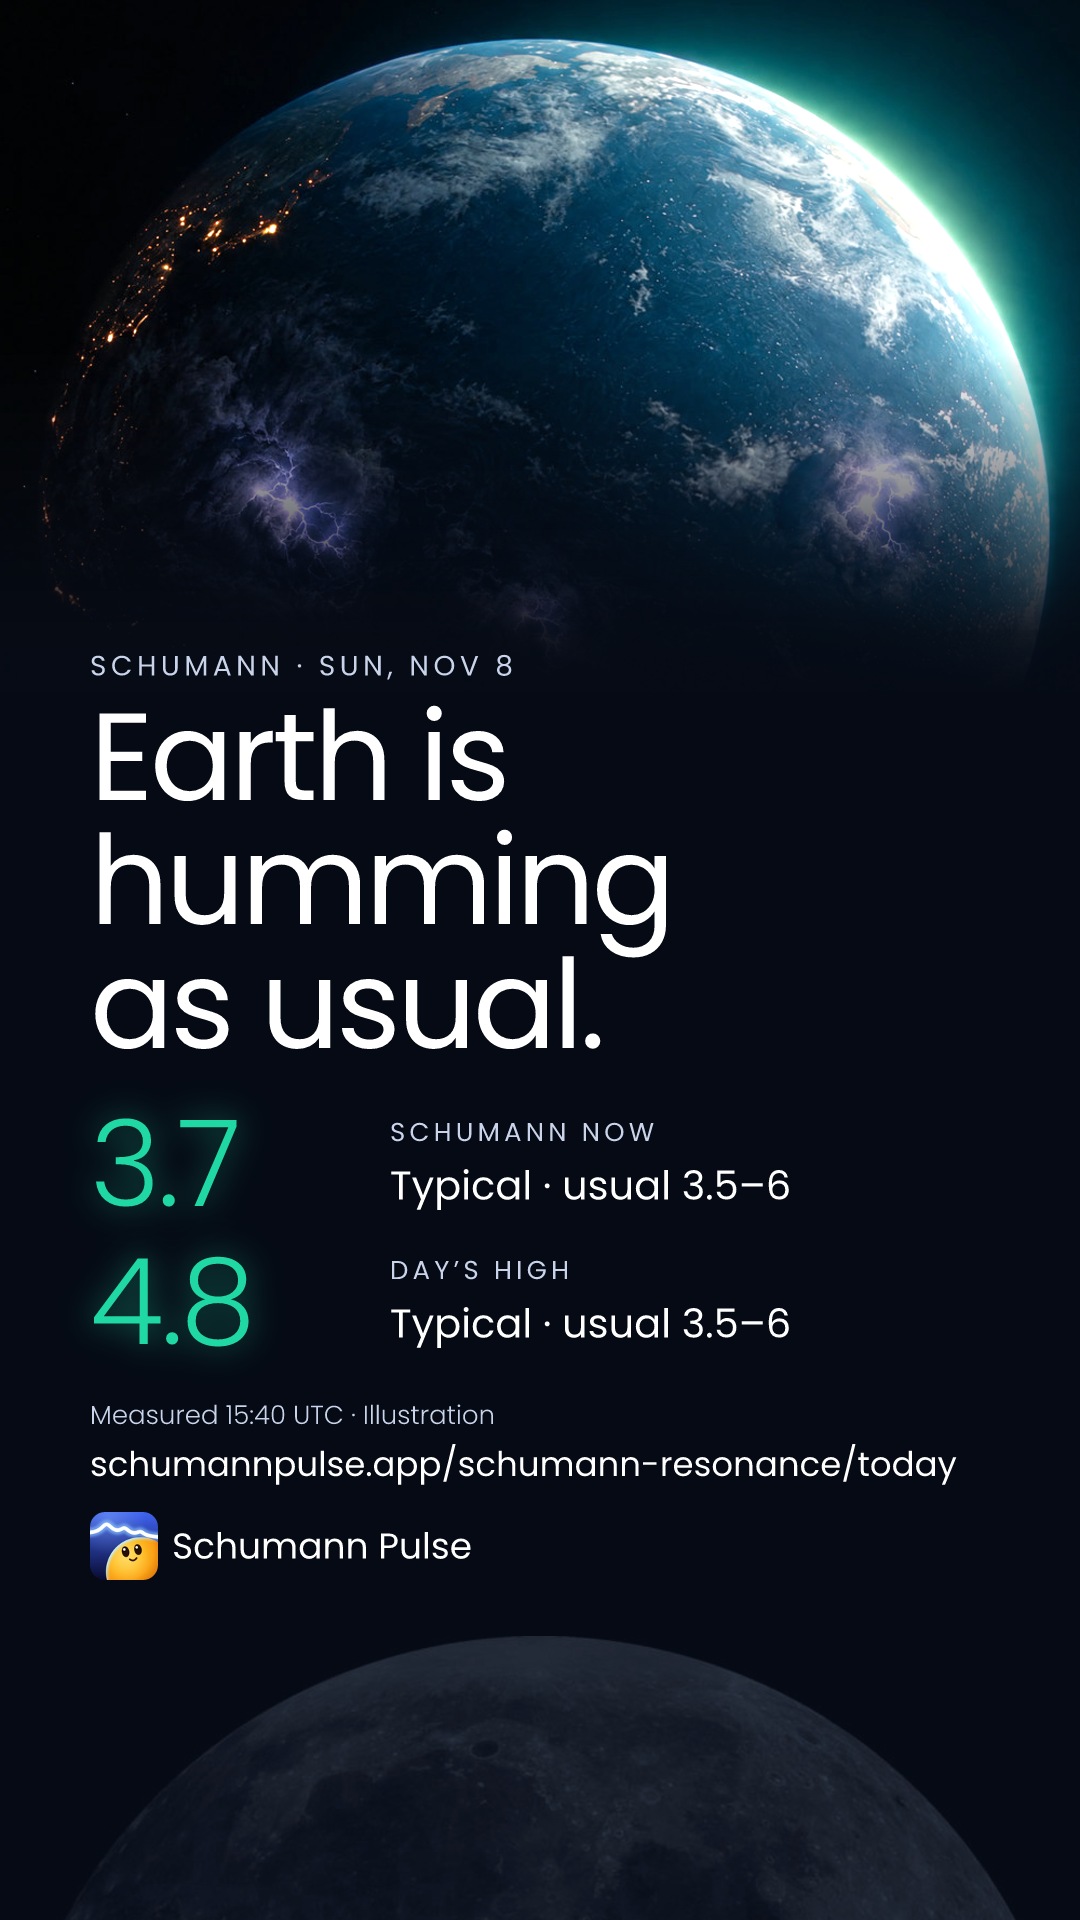
Standing in while the Siberian observatory is offline, on the same fixed scale. Relative source units, not pT. Amplitude is not frequency.
First-mode amplitude describes the strength of a signal at one station. Frequency describes where the resonance peak sits; it is a different measurement.
Tap Save story, add the image to your Story in Instagram, then use a Link sticker with the saved-page link from Copy link. The image itself is not a clickable link.
Share card opens your phone’s sharing options when supported. Available apps depend on your device.
{"topic":"schumann-resonance","data":{"status":"available","source":"Siberian observatory","source_url":"https://sos70.ru/","unit":"relative amplitude","cadence":300,"stale_after":5400,"card_version":9,"points":[{"at":"2026-11-08T00:05:00Z","value":2.653},{"at":"2026-11-08T00:10:00Z","value":2.688},{"at":"2026-11-08T00:15:00Z","value":2.646},{"at":"2026-11-08T00:20:00Z","value":2.544},{"at":"2026-11-08T00:25:00Z","value":2.505},{"at":"2026-11-08T00:30:00Z","value":2.601},{"at":"2026-11-08T00:35:00Z","value":2.619},{"at":"2026-11-08T00:40:00Z","value":2.498},{"at":"2026-11-08T00:45:00Z","value":2.431},{"at":"2026-11-08T00:50:00Z","value":2.489},{"at":"2026-11-08T00:55:00Z","value":2.547},{"at":"2026-11-08T01:00:00Z","value":2.621},{"at":"2026-11-08T01:05:00Z","value":2.745},{"at":"2026-11-08T01:10:00Z","value":2.916},{"at":"2026-11-08T01:15:00Z","value":3.005},{"at":"2026-11-08T01:20:00Z","value":2.878},{"at":"2026-11-08T01:25:00Z","value":2.784},{"at":"2026-11-08T01:30:00Z","value":2.72},{"at":"2026-11-08T01:35:00Z","value":2.687},{"at":"2026-11-08T01:40:00Z","value":2.724},{"at":"2026-11-08T01:45:00Z","value":2.775},{"at":"2026-11-08T01:50:00Z","value":2.843},{"at":"2026-11-08T01:55:00Z","value":2.883},{"at":"2026-11-08T02:00:00Z","value":2.954},{"at":"2026-11-08T02:05:00Z","value":2.946},{"at":"2026-11-08T02:10:00Z","value":2.822},{"at":"2026-11-08T02:15:00Z","value":2.809},{"at":"2026-11-08T02:20:00Z","value":2.872},{"at":"2026-11-08T02:25:00Z","value":2.982},{"at":"2026-11-08T02:35:00Z","value":3.064},{"at":"2026-11-08T02:40:00Z","value":2.923},{"at":"2026-11-08T02:45:00Z","value":3.039},{"at":"2026-11-08T02:50:00Z","value":3.112},{"at":"2026-11-08T02:55:00Z","value":3.19},{"at":"2026-11-08T03:00:00Z","value":3.21},{"at":"2026-11-08T03:25:00Z","value":2.952},{"at":"2026-11-08T03:30:00Z","value":2.938},{"at":"2026-11-08T03:35:00Z","value":2.941},{"at":"2026-11-08T03:40:00Z","value":3.164},{"at":"2026-11-08T03:45:00Z","value":3.184},{"at":"2026-11-08T03:50:00Z","value":2.95},{"at":"2026-11-08T03:55:00Z","value":2.853},{"at":"2026-11-08T04:00:00Z","value":2.899},{"at":"2026-11-08T04:05:00Z","value":2.971},{"at":"2026-11-08T04:10:00Z","value":2.985},{"at":"2026-11-08T04:15:00Z","value":2.987},{"at":"2026-11-08T04:20:00Z","value":2.95},{"at":"2026-11-08T04:25:00Z","value":2.912},{"at":"2026-11-08T04:30:00Z","value":2.981},{"at":"2026-11-08T04:35:00Z","value":3.035},{"at":"2026-11-08T04:40:00Z","value":3.01},{"at":"2026-11-08T04:45:00Z","value":3.038},{"at":"2026-11-08T04:50:00Z","value":2.983},{"at":"2026-11-08T04:55:00Z","value":2.947},{"at":"2026-11-08T05:15:00Z","value":3.278},{"at":"2026-11-08T05:20:00Z","value":3.331},{"at":"2026-11-08T05:25:00Z","value":3.389},{"at":"2026-11-08T05:35:00Z","value":3.619},{"at":"2026-11-08T05:40:00Z","value":3.651},{"at":"2026-11-08T05:45:00Z","value":3.725},{"at":"2026-11-08T05:50:00Z","value":3.763},{"at":"2026-11-08T05:55:00Z","value":3.771},{"at":"2026-11-08T06:00:00Z","value":3.483},{"at":"2026-11-08T06:05:00Z","value":3.383},{"at":"2026-11-08T06:10:00Z","value":3.503},{"at":"2026-11-08T06:15:00Z","value":3.605},{"at":"2026-11-08T06:20:00Z","value":3.67},{"at":"2026-11-08T06:25:00Z","value":3.699},{"at":"2026-11-08T06:30:00Z","value":3.666},{"at":"2026-11-08T06:35:00Z","value":3.715},{"at":"2026-11-08T06:40:00Z","value":3.809},{"at":"2026-11-08T06:45:00Z","value":3.954},{"at":"2026-11-08T06:50:00Z","value":3.988},{"at":"2026-11-08T06:55:00Z","value":3.989},{"at":"2026-11-08T07:00:00Z","value":3.945},{"at":"2026-11-08T07:05:00Z","value":3.879},{"at":"2026-11-08T07:10:00Z","value":3.788},{"at":"2026-11-08T07:15:00Z","value":3.659},{"at":"2026-11-08T07:20:00Z","value":3.589},{"at":"2026-11-08T07:25:00Z","value":3.527},{"at":"2026-11-08T07:30:00Z","value":3.517},{"at":"2026-11-08T07:35:00Z","value":3.532},{"at":"2026-11-08T07:40:00Z","value":3.591},{"at":"2026-11-08T07:45:00Z","value":3.638},{"at":"2026-11-08T07:50:00Z","value":3.752},{"at":"2026-11-08T07:55:00Z","value":3.884},{"at":"2026-11-08T08:00:00Z","value":3.996},{"at":"2026-11-08T08:10:00Z","value":4.448},{"at":"2026-11-08T08:15:00Z","value":4.418},{"at":"2026-11-08T08:20:00Z","value":3.952},{"at":"2026-11-08T08:25:00Z","value":3.851},{"at":"2026-11-08T08:30:00Z","value":3.969},{"at":"2026-11-08T08:35:00Z","value":3.857},{"at":"2026-11-08T08:40:00Z","value":3.624},{"at":"2026-11-08T08:45:00Z","value":3.634},{"at":"2026-11-08T08:50:00Z","value":3.758},{"at":"2026-11-08T08:55:00Z","value":4.111},{"at":"2026-11-08T09:00:00Z","value":3.97},{"at":"2026-11-08T09:05:00Z","value":3.812},{"at":"2026-11-08T09:10:00Z","value":3.679},{"at":"2026-11-08T09:15:00Z","value":3.811},{"at":"2026-11-08T09:20:00Z","value":3.988},{"at":"2026-11-08T09:25:00Z","value":4.657},{"at":"2026-11-08T09:30:00Z","value":4.755},{"at":"2026-11-08T09:35:00Z","value":4.66},{"at":"2026-11-08T09:40:00Z","value":4.485},{"at":"2026-11-08T09:45:00Z","value":4.283},{"at":"2026-11-08T09:50:00Z","value":4.634},{"at":"2026-11-08T09:55:00Z","value":4.607},{"at":"2026-11-08T10:00:00Z","value":4.323},{"at":"2026-11-08T10:05:00Z","value":4.075},{"at":"2026-11-08T10:10:00Z","value":3.9},{"at":"2026-11-08T10:15:00Z","value":3.86},{"at":"2026-11-08T10:20:00Z","value":3.769},{"at":"2026-11-08T10:25:00Z","value":3.776},{"at":"2026-11-08T10:30:00Z","value":4.011},{"at":"2026-11-08T10:35:00Z","value":4.259},{"at":"2026-11-08T10:40:00Z","value":4.45},{"at":"2026-11-08T10:45:00Z","value":4.711},{"at":"2026-11-08T10:50:00Z","value":5.072},{"at":"2026-11-08T10:55:00Z","value":5.379},{"at":"2026-11-08T11:00:00Z","value":5.003},{"at":"2026-11-08T11:05:00Z","value":4.79},{"at":"2026-11-08T11:10:00Z","value":4.689},{"at":"2026-11-08T11:15:00Z","value":4.752},{"at":"2026-11-08T11:20:00Z","value":4.994},{"at":"2026-11-08T11:25:00Z","value":5.211},{"at":"2026-11-08T11:30:00Z","value":4.921},{"at":"2026-11-08T11:35:00Z","value":4.735},{"at":"2026-11-08T11:40:00Z","value":4.619},{"at":"2026-11-08T11:45:00Z","value":4.485},{"at":"2026-11-08T11:50:00Z","value":4.275},{"at":"2026-11-08T11:55:00Z","value":4.091},{"at":"2026-11-08T12:00:00Z","value":4.197},{"at":"2026-11-08T12:05:00Z","value":4.357},{"at":"2026-11-08T12:10:00Z","value":4.474},{"at":"2026-11-08T12:15:00Z","value":4.412},{"at":"2026-11-08T12:20:00Z","value":4.113},{"at":"2026-11-08T12:25:00Z","value":3.827},{"at":"2026-11-08T12:30:00Z","value":4.316},{"at":"2026-11-08T12:35:00Z","value":4.595},{"at":"2026-11-08T12:40:00Z","value":4.677},{"at":"2026-11-08T12:45:00Z","value":4.564},{"at":"2026-11-08T12:50:00Z","value":4.252},{"at":"2026-11-08T12:55:00Z","value":4.001},{"at":"2026-11-08T13:00:00Z","value":3.963},{"at":"2026-11-08T13:05:00Z","value":3.989},{"at":"2026-11-08T13:10:00Z","value":3.977},{"at":"2026-11-08T13:15:00Z","value":4.02},{"at":"2026-11-08T13:20:00Z","value":4.137},{"at":"2026-11-08T13:25:00Z","value":4.256},{"at":"2026-11-08T13:30:00Z","value":4.172},{"at":"2026-11-08T13:35:00Z","value":4.112},{"at":"2026-11-08T13:40:00Z","value":4.187},{"at":"2026-11-08T13:45:00Z","value":4.25},{"at":"2026-11-08T13:50:00Z","value":4.164},{"at":"2026-11-08T13:55:00Z","value":4.109},{"at":"2026-11-08T14:00:00Z","value":4.104},{"at":"2026-11-08T14:05:00Z","value":4.082},{"at":"2026-11-08T14:10:00Z","value":3.999},{"at":"2026-11-08T14:15:00Z","value":3.947},{"at":"2026-11-08T14:20:00Z","value":4.005},{"at":"2026-11-08T14:25:00Z","value":4.082},{"at":"2026-11-08T14:30:00Z","value":4.066},{"at":"2026-11-08T14:40:00Z","value":4.023},{"at":"2026-11-08T14:45:00Z","value":3.984},{"at":"2026-11-08T14:50:00Z","value":3.889},{"at":"2026-11-08T14:55:00Z","value":3.803},{"at":"2026-11-08T15:00:00Z","value":3.82},{"at":"2026-11-08T15:05:00Z","value":3.844},{"at":"2026-11-08T15:10:00Z","value":3.876},{"at":"2026-11-08T15:15:00Z","value":3.913},{"at":"2026-11-08T15:20:00Z","value":3.848},{"at":"2026-11-08T15:25:00Z","value":3.784},{"at":"2026-11-08T15:30:00Z","value":3.683},{"at":"2026-11-08T15:35:00Z","value":3.613},{"at":"2026-11-08T15:40:00Z","value":3.569}],"frequency":[{"at":"2026-11-08T00:05:00Z","value":7.95},{"at":"2026-11-08T00:10:00Z","value":7.958},{"at":"2026-11-08T00:15:00Z","value":7.963},{"at":"2026-11-08T00:20:00Z","value":7.954},{"at":"2026-11-08T00:25:00Z","value":7.948},{"at":"2026-11-08T00:30:00Z","value":7.943},{"at":"2026-11-08T00:35:00Z","value":7.945},{"at":"2026-11-08T00:40:00Z","value":7.958},{"at":"2026-11-08T00:45:00Z","value":7.963},{"at":"2026-11-08T00:50:00Z","value":7.953},{"at":"2026-11-08T00:55:00Z","value":7.944},{"at":"2026-11-08T01:00:00Z","value":7.938},{"at":"2026-11-08T01:05:00Z","value":7.937},{"at":"2026-11-08T01:10:00Z","value":7.945},{"at":"2026-11-08T01:15:00Z","value":7.947},{"at":"2026-11-08T01:20:00Z","value":7.942},{"at":"2026-11-08T01:25:00Z","value":7.938},{"at":"2026-11-08T01:30:00Z","value":7.938},{"at":"2026-11-08T01:35:00Z","value":7.936},{"at":"2026-11-08T01:40:00Z","value":7.938},{"at":"2026-11-08T01:45:00Z","value":7.94},{"at":"2026-11-08T01:50:00Z","value":7.945},{"at":"2026-11-08T01:55:00Z","value":7.947},{"at":"2026-11-08T02:00:00Z","value":7.95},{"at":"2026-11-08T02:05:00Z","value":7.952},{"at":"2026-11-08T02:10:00Z","value":7.951},{"at":"2026-11-08T02:15:00Z","value":7.952},{"at":"2026-11-08T02:20:00Z","value":7.954},{"at":"2026-11-08T02:25:00Z","value":7.955},{"at":"2026-11-08T02:35:00Z","value":7.945},{"at":"2026-11-08T02:40:00Z","value":7.939},{"at":"2026-11-08T02:45:00Z","value":7.938},{"at":"2026-11-08T02:50:00Z","value":7.946},{"at":"2026-11-08T02:55:00Z","value":7.948},{"at":"2026-11-08T03:00:00Z","value":7.942},{"at":"2026-11-08T03:25:00Z","value":7.948},{"at":"2026-11-08T03:30:00Z","value":7.939},{"at":"2026-11-08T03:35:00Z","value":7.933},{"at":"2026-11-08T03:40:00Z","value":7.933},{"at":"2026-11-08T03:45:00Z","value":7.935},{"at":"2026-11-08T03:50:00Z","value":7.938},{"at":"2026-11-08T03:55:00Z","value":7.936},{"at":"2026-11-08T04:00:00Z","value":7.918},{"at":"2026-11-08T04:05:00Z","value":7.908},{"at":"2026-11-08T04:10:00Z","value":7.924},{"at":"2026-11-08T04:15:00Z","value":7.932},{"at":"2026-11-08T04:20:00Z","value":7.93},{"at":"2026-11-08T04:25:00Z","value":7.93},{"at":"2026-11-08T04:30:00Z","value":7.938},{"at":"2026-11-08T04:35:00Z","value":7.945},{"at":"2026-11-08T04:40:00Z","value":7.937},{"at":"2026-11-08T04:45:00Z","value":7.931},{"at":"2026-11-08T04:50:00Z","value":7.93},{"at":"2026-11-08T04:55:00Z","value":7.929},{"at":"2026-11-08T05:15:00Z","value":7.912},{"at":"2026-11-08T05:20:00Z","value":7.904},{"at":"2026-11-08T05:25:00Z","value":7.898},{"at":"2026-11-08T05:35:00Z","value":7.897},{"at":"2026-11-08T05:40:00Z","value":7.909},{"at":"2026-11-08T05:45:00Z","value":7.92},{"at":"2026-11-08T05:50:00Z","value":7.911},{"at":"2026-11-08T05:55:00Z","value":7.903},{"at":"2026-11-08T06:00:00Z","value":7.9},{"at":"2026-11-08T06:05:00Z","value":7.902},{"at":"2026-11-08T06:10:00Z","value":7.909},{"at":"2026-11-08T06:15:00Z","value":7.917},{"at":"2026-11-08T06:20:00Z","value":7.913},{"at":"2026-11-08T06:25:00Z","value":7.91},{"at":"2026-11-08T06:30:00Z","value":7.902},{"at":"2026-11-08T06:35:00Z","value":7.888},{"at":"2026-11-08T06:40:00Z","value":7.86},{"at":"2026-11-08T06:45:00Z","value":7.858},{"at":"2026-11-08T06:50:00Z","value":7.884},{"at":"2026-11-08T06:55:00Z","value":7.892},{"at":"2026-11-08T07:00:00Z","value":7.875},{"at":"2026-11-08T07:05:00Z","value":7.875},{"at":"2026-11-08T07:10:00Z","value":7.89},{"at":"2026-11-08T07:15:00Z","value":7.884},{"at":"2026-11-08T07:20:00Z","value":7.859},{"at":"2026-11-08T07:25:00Z","value":7.856},{"at":"2026-11-08T07:30:00Z","value":7.877},{"at":"2026-11-08T07:35:00Z","value":7.891},{"at":"2026-11-08T07:40:00Z","value":7.894},{"at":"2026-11-08T07:45:00Z","value":7.887},{"at":"2026-11-08T07:50:00Z","value":7.869},{"at":"2026-11-08T07:55:00Z","value":7.86},{"at":"2026-11-08T08:00:00Z","value":7.856},{"at":"2026-11-08T08:10:00Z","value":7.82},{"at":"2026-11-08T08:15:00Z","value":7.82},{"at":"2026-11-08T08:20:00Z","value":7.852},{"at":"2026-11-08T08:25:00Z","value":7.856},{"at":"2026-11-08T08:30:00Z","value":7.827},{"at":"2026-11-08T08:35:00Z","value":7.809},{"at":"2026-11-08T08:40:00Z","value":7.841},{"at":"2026-11-08T08:45:00Z","value":7.858},{"at":"2026-11-08T08:50:00Z","value":7.853},{"at":"2026-11-08T08:55:00Z","value":7.854},{"at":"2026-11-08T09:00:00Z","value":7.863},{"at":"2026-11-08T09:05:00Z","value":7.87},{"at":"2026-11-08T09:10:00Z","value":7.864},{"at":"2026-11-08T09:15:00Z","value":7.859},{"at":"2026-11-08T09:20:00Z","value":7.853},{"at":"2026-11-08T09:25:00Z","value":7.854},{"at":"2026-11-08T09:30:00Z","value":7.861},{"at":"2026-11-08T09:35:00Z","value":7.862},{"at":"2026-11-08T09:40:00Z","value":7.853},{"at":"2026-11-08T09:45:00Z","value":7.854},{"at":"2026-11-08T09:50:00Z","value":7.871},{"at":"2026-11-08T09:55:00Z","value":7.898},{"at":"2026-11-08T10:00:00Z","value":7.878},{"at":"2026-11-08T10:05:00Z","value":7.875},{"at":"2026-11-08T10:10:00Z","value":7.878},{"at":"2026-11-08T10:15:00Z","value":7.885},{"at":"2026-11-08T10:20:00Z","value":7.894},{"at":"2026-11-08T10:25:00Z","value":7.894},{"at":"2026-11-08T10:30:00Z","value":7.88},{"at":"2026-11-08T10:35:00Z","value":7.868},{"at":"2026-11-08T10:40:00Z","value":7.878},{"at":"2026-11-08T10:45:00Z","value":7.884},{"at":"2026-11-08T10:50:00Z","value":7.878},{"at":"2026-11-08T10:55:00Z","value":7.868},{"at":"2026-11-08T11:00:00Z","value":7.848},{"at":"2026-11-08T11:05:00Z","value":7.846},{"at":"2026-11-08T11:10:00Z","value":7.872},{"at":"2026-11-08T11:15:00Z","value":7.891},{"at":"2026-11-08T11:20:00Z","value":7.874},{"at":"2026-11-08T11:25:00Z","value":7.86},{"at":"2026-11-08T11:30:00Z","value":7.866},{"at":"2026-11-08T11:35:00Z","value":7.874},{"at":"2026-11-08T11:40:00Z","value":7.888},{"at":"2026-11-08T11:45:00Z","value":7.905},{"at":"2026-11-08T11:50:00Z","value":7.929},{"at":"2026-11-08T11:55:00Z","value":7.948},{"at":"2026-11-08T12:00:00Z","value":7.931},{"at":"2026-11-08T12:05:00Z","value":7.921},{"at":"2026-11-08T12:10:00Z","value":7.926},{"at":"2026-11-08T12:15:00Z","value":7.934},{"at":"2026-11-08T12:20:00Z","value":7.946},{"at":"2026-11-08T12:25:00Z","value":7.957},{"at":"2026-11-08T12:30:00Z","value":7.93},{"at":"2026-11-08T12:35:00Z","value":7.916},{"at":"2026-11-08T12:40:00Z","value":7.94},{"at":"2026-11-08T12:45:00Z","value":7.958},{"at":"2026-11-08T12:50:00Z","value":7.963},{"at":"2026-11-08T12:55:00Z","value":7.961},{"at":"2026-11-08T13:00:00Z","value":7.949},{"at":"2026-11-08T13:05:00Z","value":7.952},{"at":"2026-11-08T13:10:00Z","value":7.976},{"at":"2026-11-08T13:15:00Z","value":7.998},{"at":"2026-11-08T13:20:00Z","value":7.991},{"at":"2026-11-08T13:25:00Z","value":7.986},{"at":"2026-11-08T13:30:00Z","value":7.984},{"at":"2026-11-08T13:35:00Z","value":7.981},{"at":"2026-11-08T13:40:00Z","value":7.977},{"at":"2026-11-08T13:45:00Z","value":7.971},{"at":"2026-11-08T13:50:00Z","value":7.961},{"at":"2026-11-08T13:55:00Z","value":7.952},{"at":"2026-11-08T14:00:00Z","value":7.963},{"at":"2026-11-08T14:05:00Z","value":7.971},{"at":"2026-11-08T14:10:00Z","value":7.972},{"at":"2026-11-08T14:15:00Z","value":7.975},{"at":"2026-11-08T14:20:00Z","value":7.984},{"at":"2026-11-08T14:25:00Z","value":7.992},{"at":"2026-11-08T14:30:00Z","value":7.984},{"at":"2026-11-08T14:40:00Z","value":7.989},{"at":"2026-11-08T14:45:00Z","value":7.999},{"at":"2026-11-08T14:50:00Z","value":8.001},{"at":"2026-11-08T14:55:00Z","value":7.999},{"at":"2026-11-08T15:00:00Z","value":7.986},{"at":"2026-11-08T15:05:00Z","value":7.976},{"at":"2026-11-08T15:10:00Z","value":7.978},{"at":"2026-11-08T15:15:00Z","value":7.982},{"at":"2026-11-08T15:20:00Z","value":7.976},{"at":"2026-11-08T15:25:00Z","value":7.977},{"at":"2026-11-08T15:30:00Z","value":7.992},{"at":"2026-11-08T15:35:00Z","value":8.007},{"at":"2026-11-08T15:40:00Z","value":7.99}],"snapshots":{"2026-11-08":"26aba131f91f4dfd121fbf66bf4d63d29ebd741492d5f63681bbd9f790920b41"},"backup":{"station":"hungary","ranges":[["2026-11-08T00:05:00Z","2026-11-08T15:40:00Z"]]},"estimate":null,"secondary":null},"now":1794354717865,"date":"2026-11-08","compare":false,"snapshot":{"id":"26aba131f91f4dfd121fbf66bf4d63d29ebd741492d5f63681bbd9f790920b41","topic":"schumann-resonance","date":"2026-11-08","captured_at":"2026-11-08T16:11:21Z","card_version":9,"card":{"phrase":"Earth is humming as usual.","caption":["Measured 15:40 UTC"],"columns":[{"kicker":"Schumann now","number":"3.7","tone":"typical","badge":null,"word":"Typical · usual 3.5–6"},{"kicker":"Day’s high","number":"4.8","tone":"typical","badge":null,"word":"Typical · usual 3.5–6"}]}},"format":"card"}
Schumann Pulse for iPhone
A little context. With you through the day.
Keep your energy, mood and focus ratings beside dated observations. Add sleep quality and everyday context to your diary, then explore available comparisons as suitable history grows.
Schumann resonances are electromagnetic resonances of the Earth–ionosphere cavity, mainly excited by lightning. A station measures a local signal shaped by global activity, propagation, local interference and its instruments.
Amplitude describes signal strength. Frequency, measured in hertz, describes the position of a resonance peak. The often-quoted 7.83 Hz is an approximate reference for the first mode, not a live reading or a fixed number for every moment. Different instruments and source units mean the stations’ amplitudes should not be combined into a global score.
For the Siberian station, we draw original charts from subscribed numeric observations, using five-minute averages of samples around each timestamp. Times are converted to UTC. The chart shows the current UTC day; missing observations remain gaps. Before new readings arrive, the latest available measurement keeps its original date. A reading more than 90 minutes old is marked delayed. While the Siberian station is offline (no reading for three hours), Nagycenk in Hungary stands in: its readings, taken from its public chart on the same fixed scale, give the level and the frequency and fill the chart from half an hour after the Siberian station’s last reading. The two stations are never averaged, and their lines never join. Etna provides an attributed source spectrogram.
 Schumann Pulse for iPhone